Free Access
Fig. 2
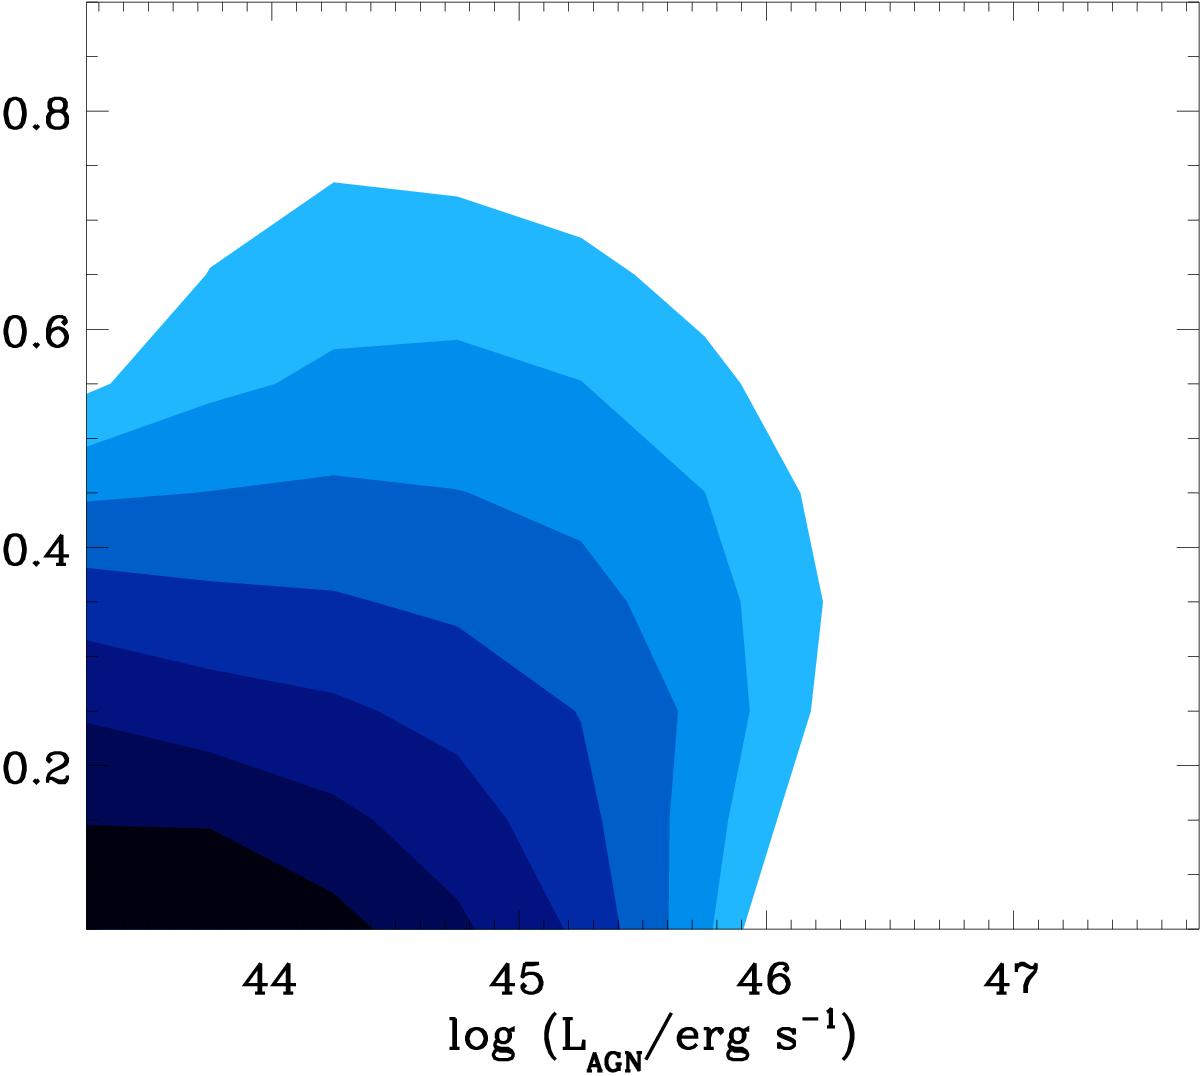
Distribution of simulated AGN as a function of ![]() and AGN bolometric luminosity for our fiducial model. The contours correspond to equally spaced values of the density (per Mpc3) of objects in a given
and AGN bolometric luminosity for our fiducial model. The contours correspond to equally spaced values of the density (per Mpc3) of objects in a given ![]() –LAGN bin in logarithmic scale: from 10-5 for the lightest filled region to 10-2 for the darkest.
–LAGN bin in logarithmic scale: from 10-5 for the lightest filled region to 10-2 for the darkest.
Current usage metrics show cumulative count of Article Views (full-text article views including HTML views, PDF and ePub downloads, according to the available data) and Abstracts Views on Vision4Press platform.
Data correspond to usage on the plateform after 2015. The current usage metrics is available 48-96 hours after online publication and is updated daily on week days.
Initial download of the metrics may take a while.