Free Access
Fig. 4
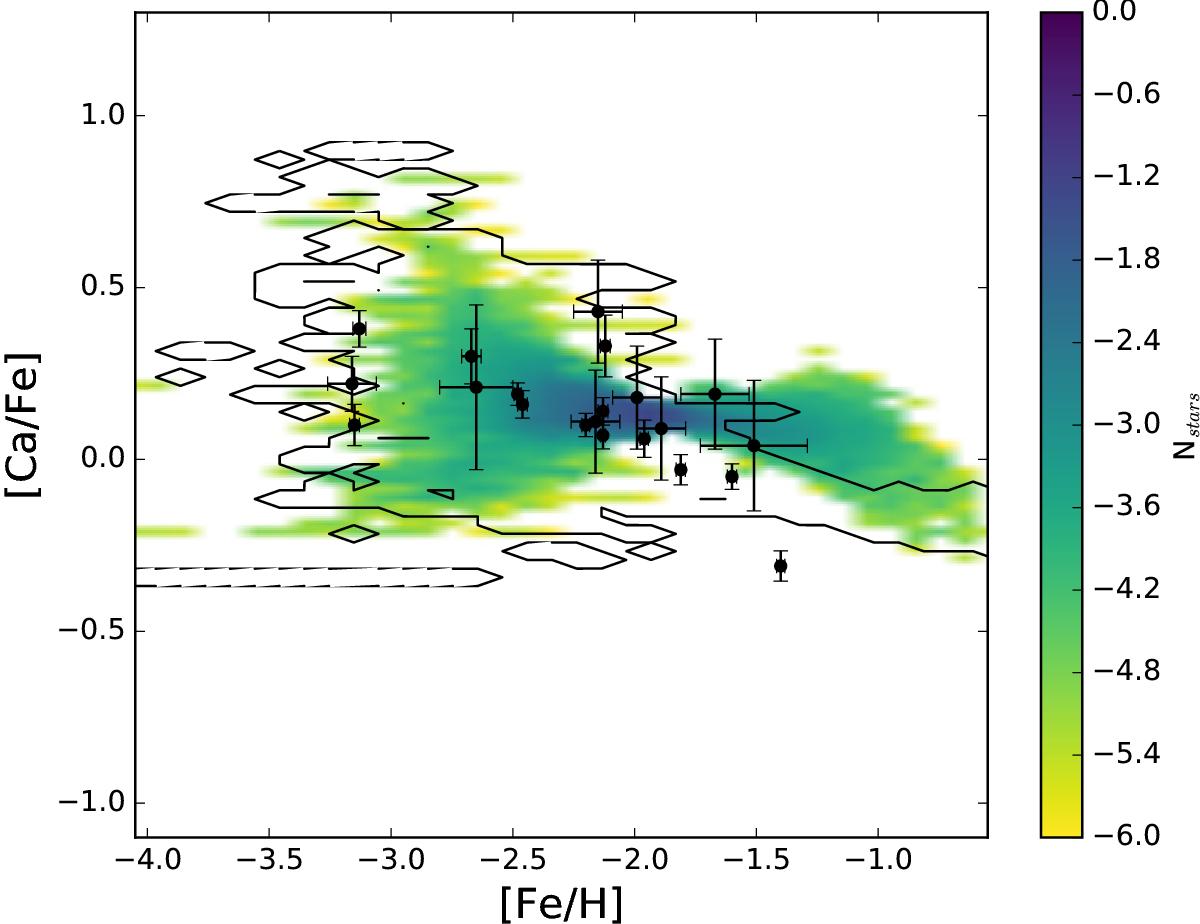
[Ca/Fe] vs. [Fe/H]; the data are the same as in Fig. 3. Here we show the results with the stochastic modelling. The colour-coded surface density plot presents the density of long-living stars for the Herts model (see colour-bar), whereas the results of the Trieste model are displayed with a black contour.
Current usage metrics show cumulative count of Article Views (full-text article views including HTML views, PDF and ePub downloads, according to the available data) and Abstracts Views on Vision4Press platform.
Data correspond to usage on the plateform after 2015. The current usage metrics is available 48-96 hours after online publication and is updated daily on week days.
Initial download of the metrics may take a while.