Free Access
Fig. 3
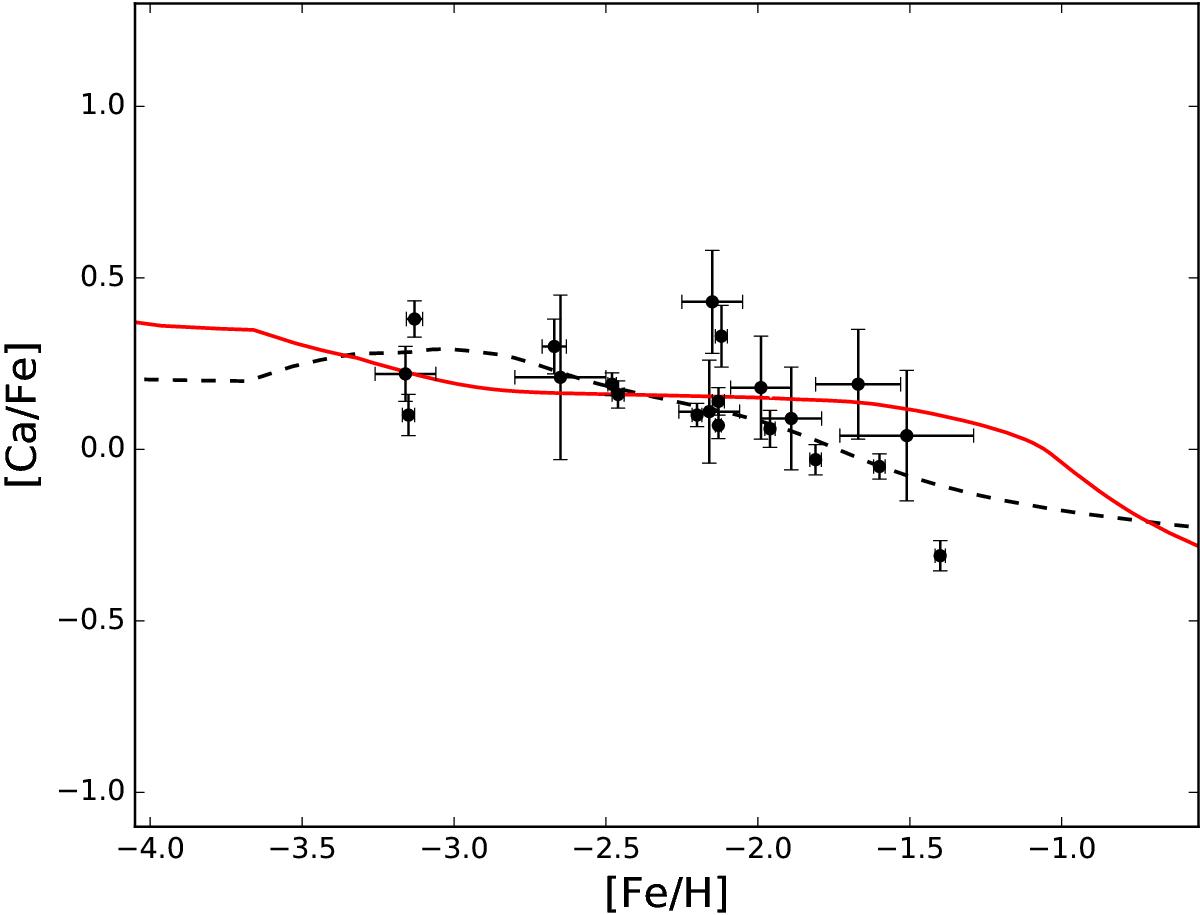
[Ca/Fe] vs. [Fe/H]; the data in black represent the abundances measured in stars belonging to the dSph Ursa Minor presented in Ural et al. (2015). The red solid line shows the results obtained with the homogeneous chemical evolution by the Herts model, whereas the dashed black line displays the results of the Trieste model.
Current usage metrics show cumulative count of Article Views (full-text article views including HTML views, PDF and ePub downloads, according to the available data) and Abstracts Views on Vision4Press platform.
Data correspond to usage on the plateform after 2015. The current usage metrics is available 48-96 hours after online publication and is updated daily on week days.
Initial download of the metrics may take a while.