Fig. A.1
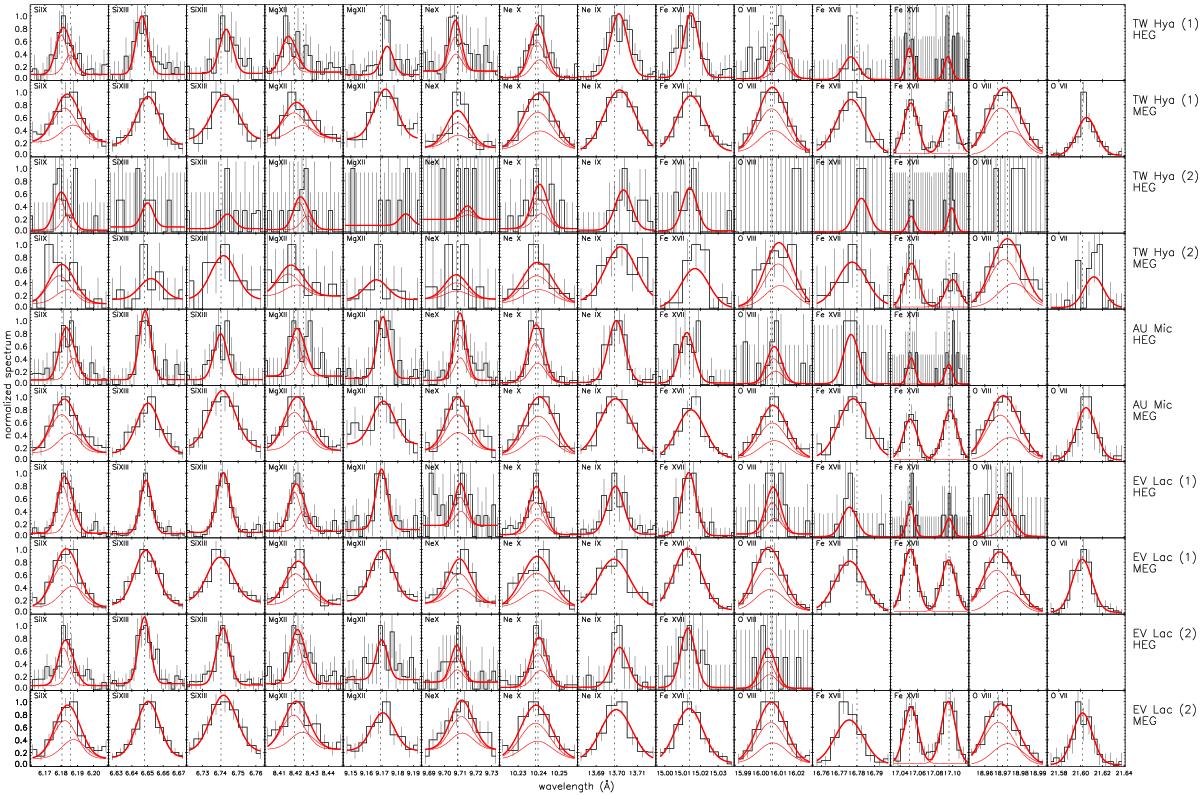
Observed HEG and MEG spectra of TW Hya (1), TW Hya (2), AU Mic, EV Lac (1), and EV Lac (2), in the regions of the selected emission lines (black) with the best-fit functions superimposed (thick red line). In the case of resonance doublets, we plot also the individual Gaussian components (thin red line). Dashed vertical lines indicate the positions of the predicted wavelengths.
Current usage metrics show cumulative count of Article Views (full-text article views including HTML views, PDF and ePub downloads, according to the available data) and Abstracts Views on Vision4Press platform.
Data correspond to usage on the plateform after 2015. The current usage metrics is available 48-96 hours after online publication and is updated daily on week days.
Initial download of the metrics may take a while.