Fig. 4
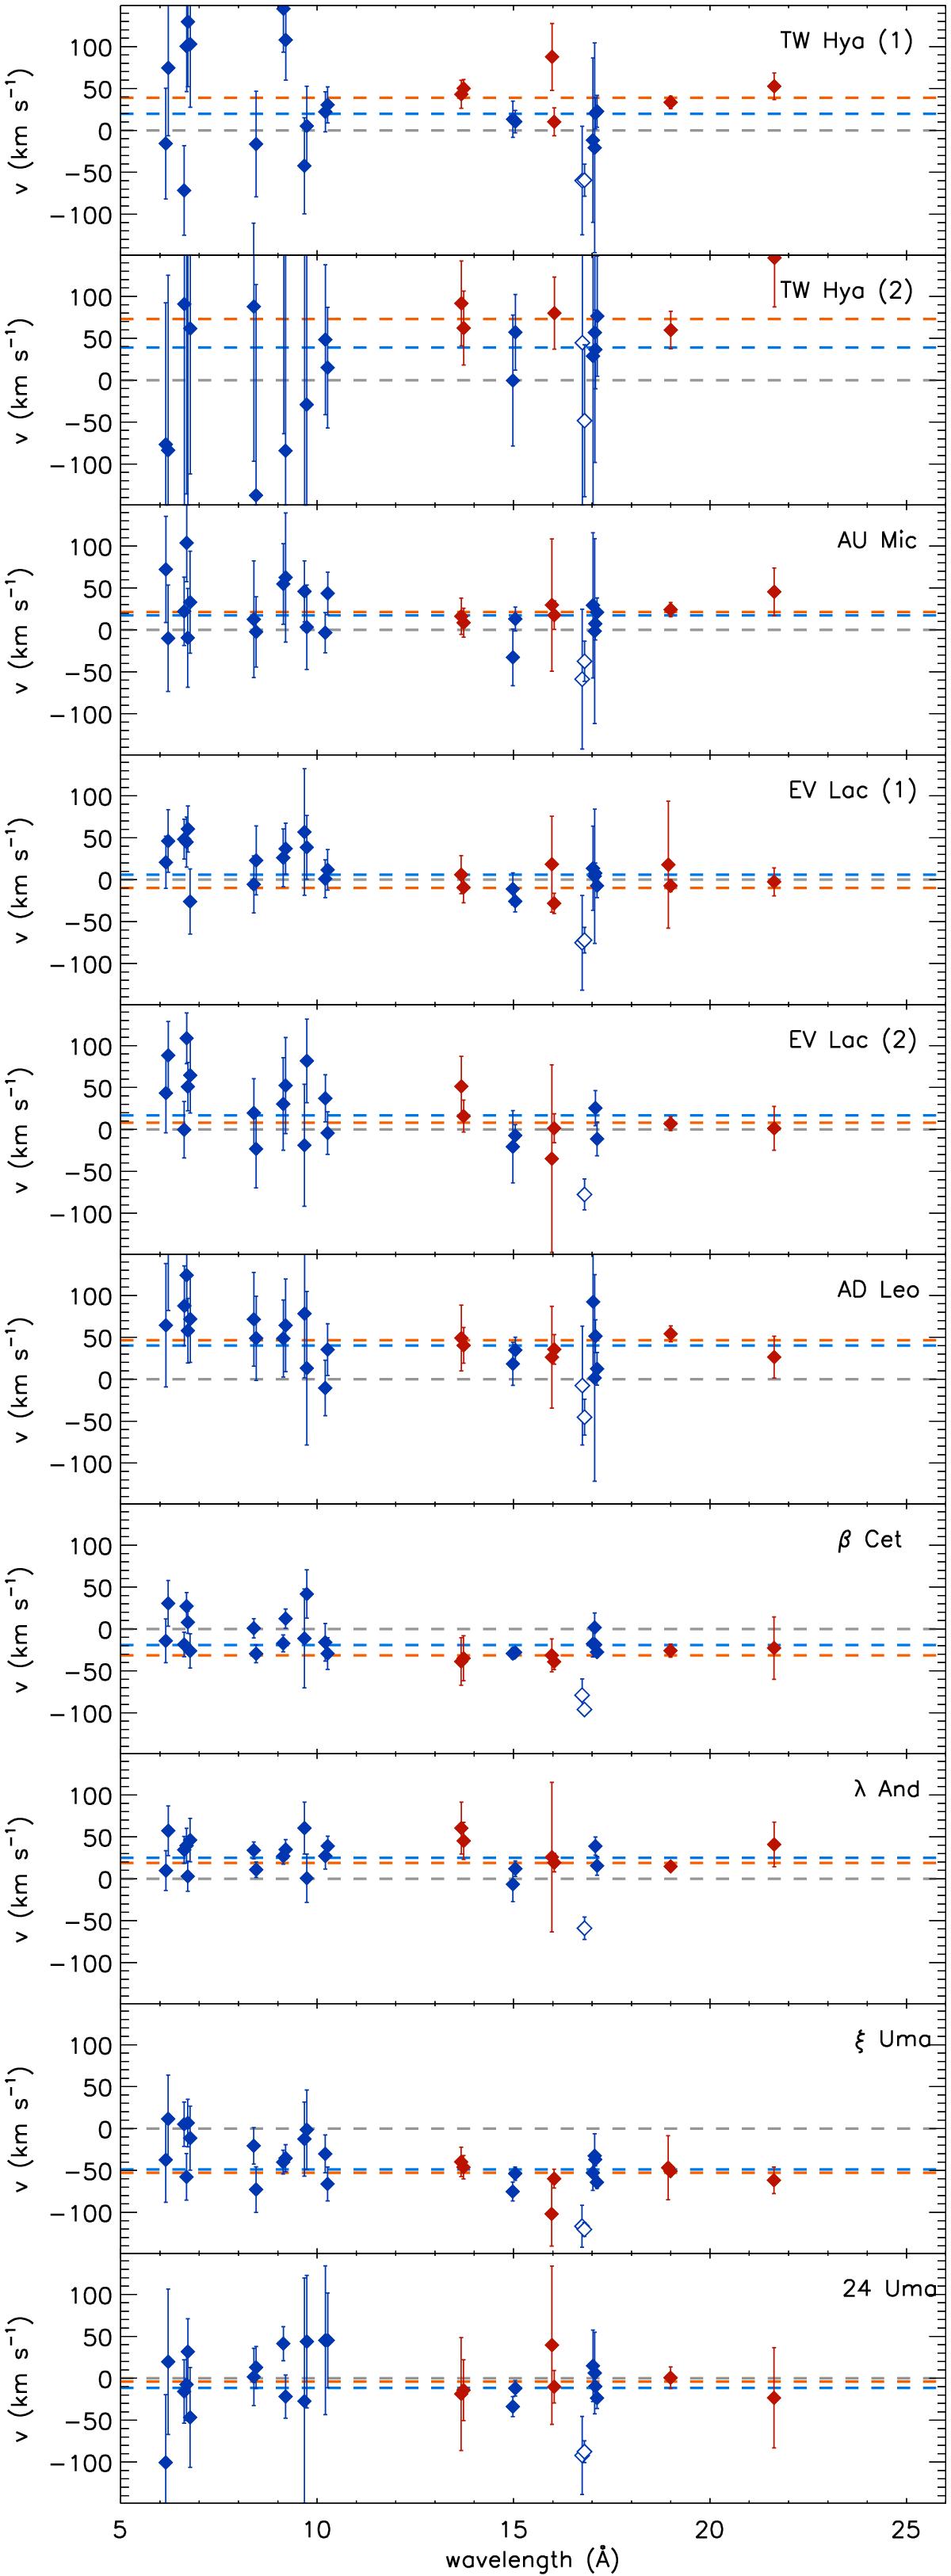
Velocity obtained from each fitted line, for each inspected spectrum, with respect to the Chandra satellite reference frame. The red and blue diamonds indicate lines included in the cool and hot line sample, respectively, and errors refer to the 1σ level. The red and blue dashed lines correspond to the average velocities, vXc and vXh, obtained for the cool and hot line sample. The velocity measured for the Fe xvii line at 16.78 Å, not included in the average velocity computation, is indicated with an open diamond. To clarify, we included a small wavelength offset in those points corresponding to the same line fitted in the two gratings.
Current usage metrics show cumulative count of Article Views (full-text article views including HTML views, PDF and ePub downloads, according to the available data) and Abstracts Views on Vision4Press platform.
Data correspond to usage on the plateform after 2015. The current usage metrics is available 48-96 hours after online publication and is updated daily on week days.
Initial download of the metrics may take a while.