Free Access
Fig. 3
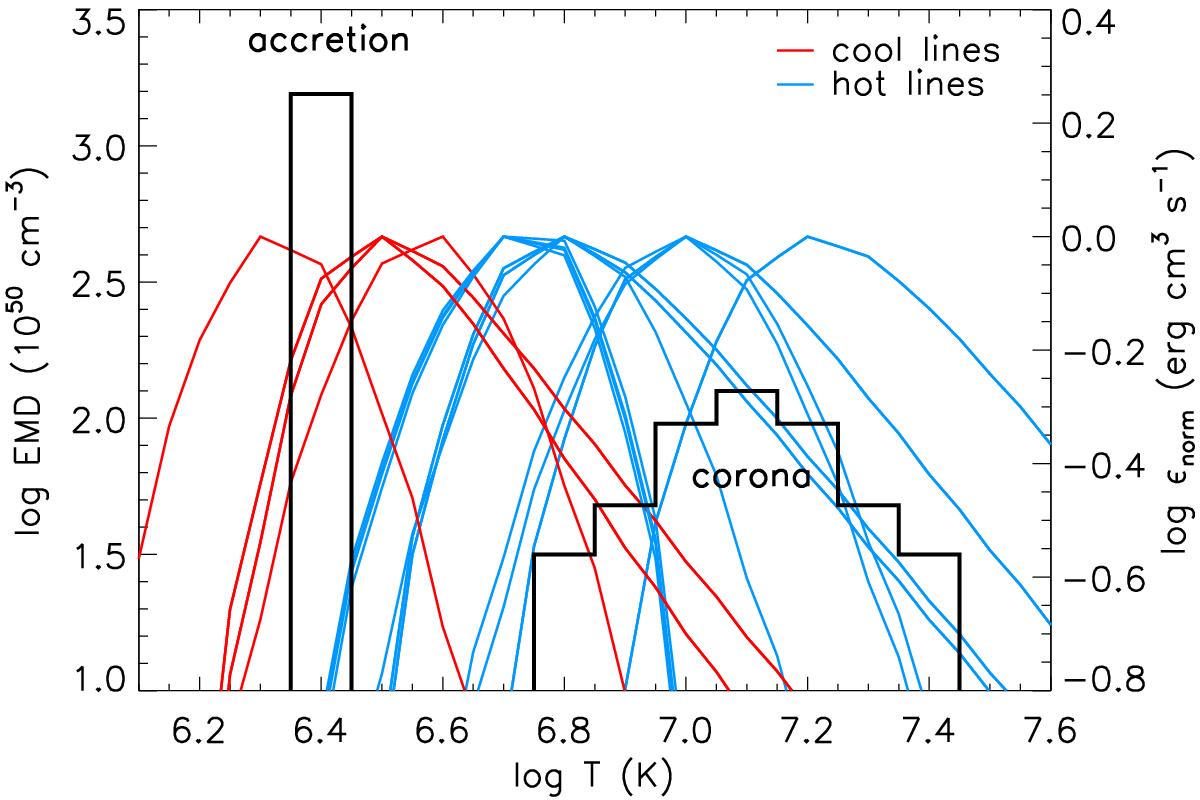
EMD (in black) of the X-ray emitting plasma in TW Hya, composed by an accretion component and a coronal component (model C derived by Brickhouse et al. 2010). Red and blue curves indicate the normalized emissivity function ϵnorm of the cool and hot selected lines.
Current usage metrics show cumulative count of Article Views (full-text article views including HTML views, PDF and ePub downloads, according to the available data) and Abstracts Views on Vision4Press platform.
Data correspond to usage on the plateform after 2015. The current usage metrics is available 48-96 hours after online publication and is updated daily on week days.
Initial download of the metrics may take a while.