Fig. 6
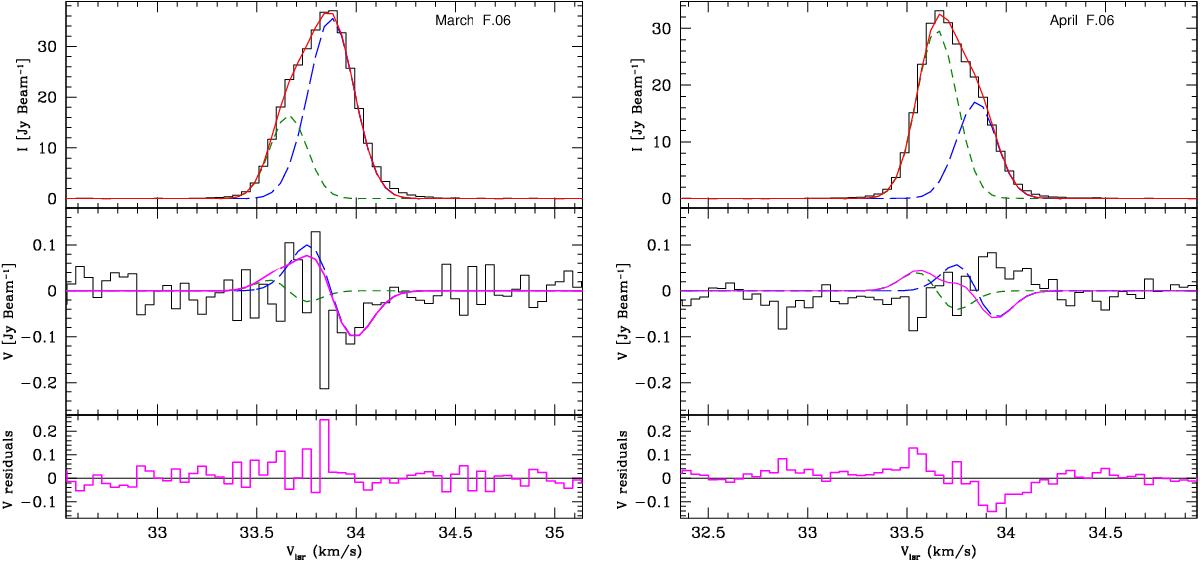
Fit to maser feature F.06 assuming the presence of two hyperfine components; left: March observation, right: April observation. Upper panels: total intensity I spectrum plotted as the black histogram. The solid red curve in the upper panel is the best fit using two Gaussian components, representing two maser hyperfine components separated by 0.2 km s-1 (see Sect. 5.4). Component 1 is the blue long-dashed line and component 2 is the green short-dashed line. Middle panels: circular polarisation V spectrum (black histogram). The solid magenta line is the sum of the derivatives of the two components of the fit from the upper panel. The blue long-dashed line is the derivative of component 1 and the green short-dashed line is the derivative of component 2. Lower panels: we plot the residuals between the circular polarisation (middle panel, black histogram) and the sum of the derivatives (middle panel, solid magenta line).
Current usage metrics show cumulative count of Article Views (full-text article views including HTML views, PDF and ePub downloads, according to the available data) and Abstracts Views on Vision4Press platform.
Data correspond to usage on the plateform after 2015. The current usage metrics is available 48-96 hours after online publication and is updated daily on week days.
Initial download of the metrics may take a while.