Fig. 4
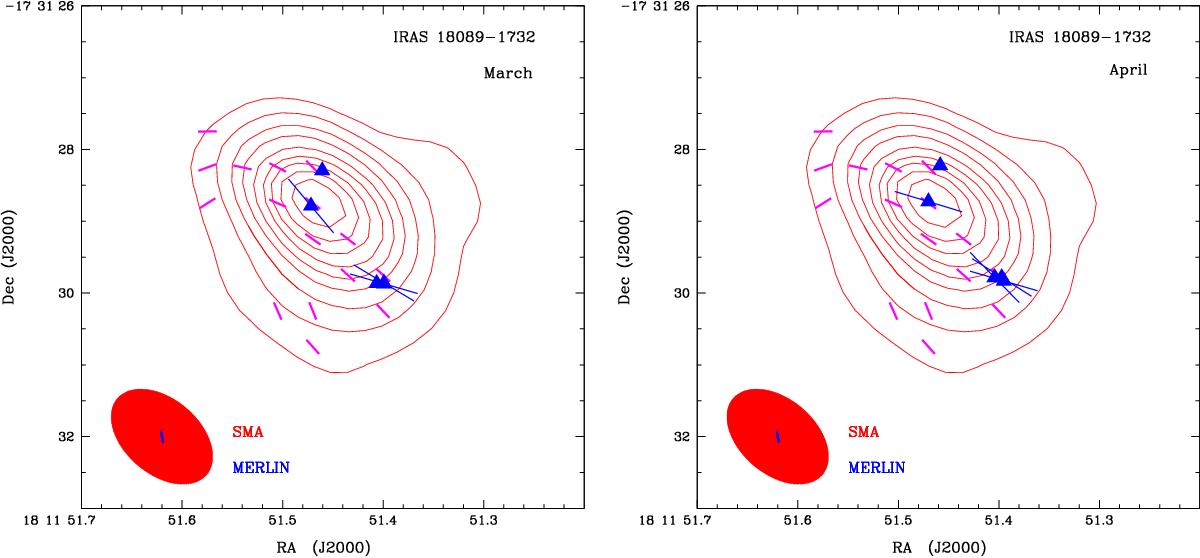
Masers in the blue group (blue triangles and blue segments) superimposed on the integrated I image of the dust continuum emission observed by Beuther et al. (2010) at 880 μm with SMA (red contours; the contours are drawn in 10σ steps). The magenta line segments show the magnetic field orientation obtained by linearly polarised dust emission (Beuther et al. 2010). The blue segments represent the magnetic field orientation obtained by our linearly polarised methanol maser emission (Sect. 5.2); therefore the magnetic field follows the same direction indicated by the dust emission. The red and blue ellipses show the beams of SMA (1.65″ × 1.05″, position angle 51°) and MERLIN, respectively. Left panel: March; right panel: April.

Current usage metrics show cumulative count of Article Views (full-text article views including HTML views, PDF and ePub downloads, according to the available data) and Abstracts Views on Vision4Press platform.
Data correspond to usage on the plateform after 2015. The current usage metrics is available 48-96 hours after online publication and is updated daily on week days.
Initial download of the metrics may take a while.