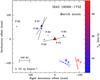
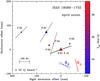
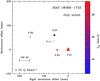
Fig. 3
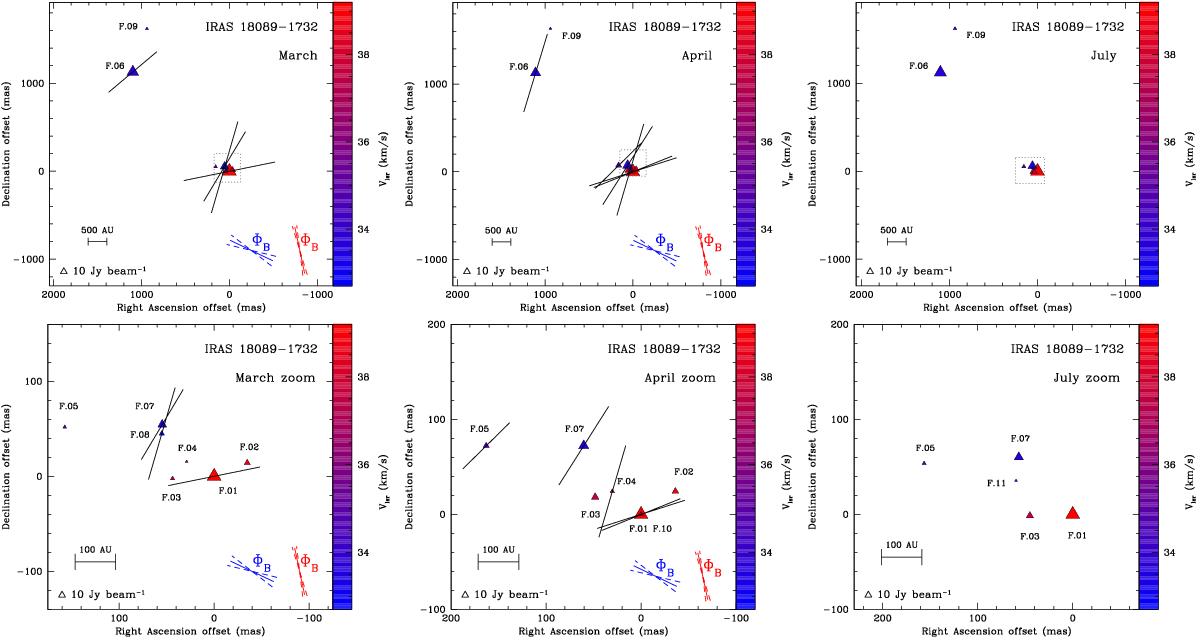
Masers identified in March (left), April (centre) and July (right) as listed in Tables 3–5. The bottom panel shows a zoom of the region marked by the dashed grey boxes in the top panels. Each maser is represented by a triangle. The different sizes of the triangles represent the intensity, while the colours indicate the velocity of the maser feature, according to the scale reported in the colour bar. Line segments mark the direction of the polarisation angle for the maser features that show linear polarisation. The average direction of the resulting magnetic field ΦB obtained for two groups of masers as defined in Sect. 5.2 is indicated in the bottom right corners of each panel. The July observations were in dual circular polarisation only.
Current usage metrics show cumulative count of Article Views (full-text article views including HTML views, PDF and ePub downloads, according to the available data) and Abstracts Views on Vision4Press platform.
Data correspond to usage on the plateform after 2015. The current usage metrics is available 48-96 hours after online publication and is updated daily on week days.
Initial download of the metrics may take a while.