Free Access
Fig. B.1
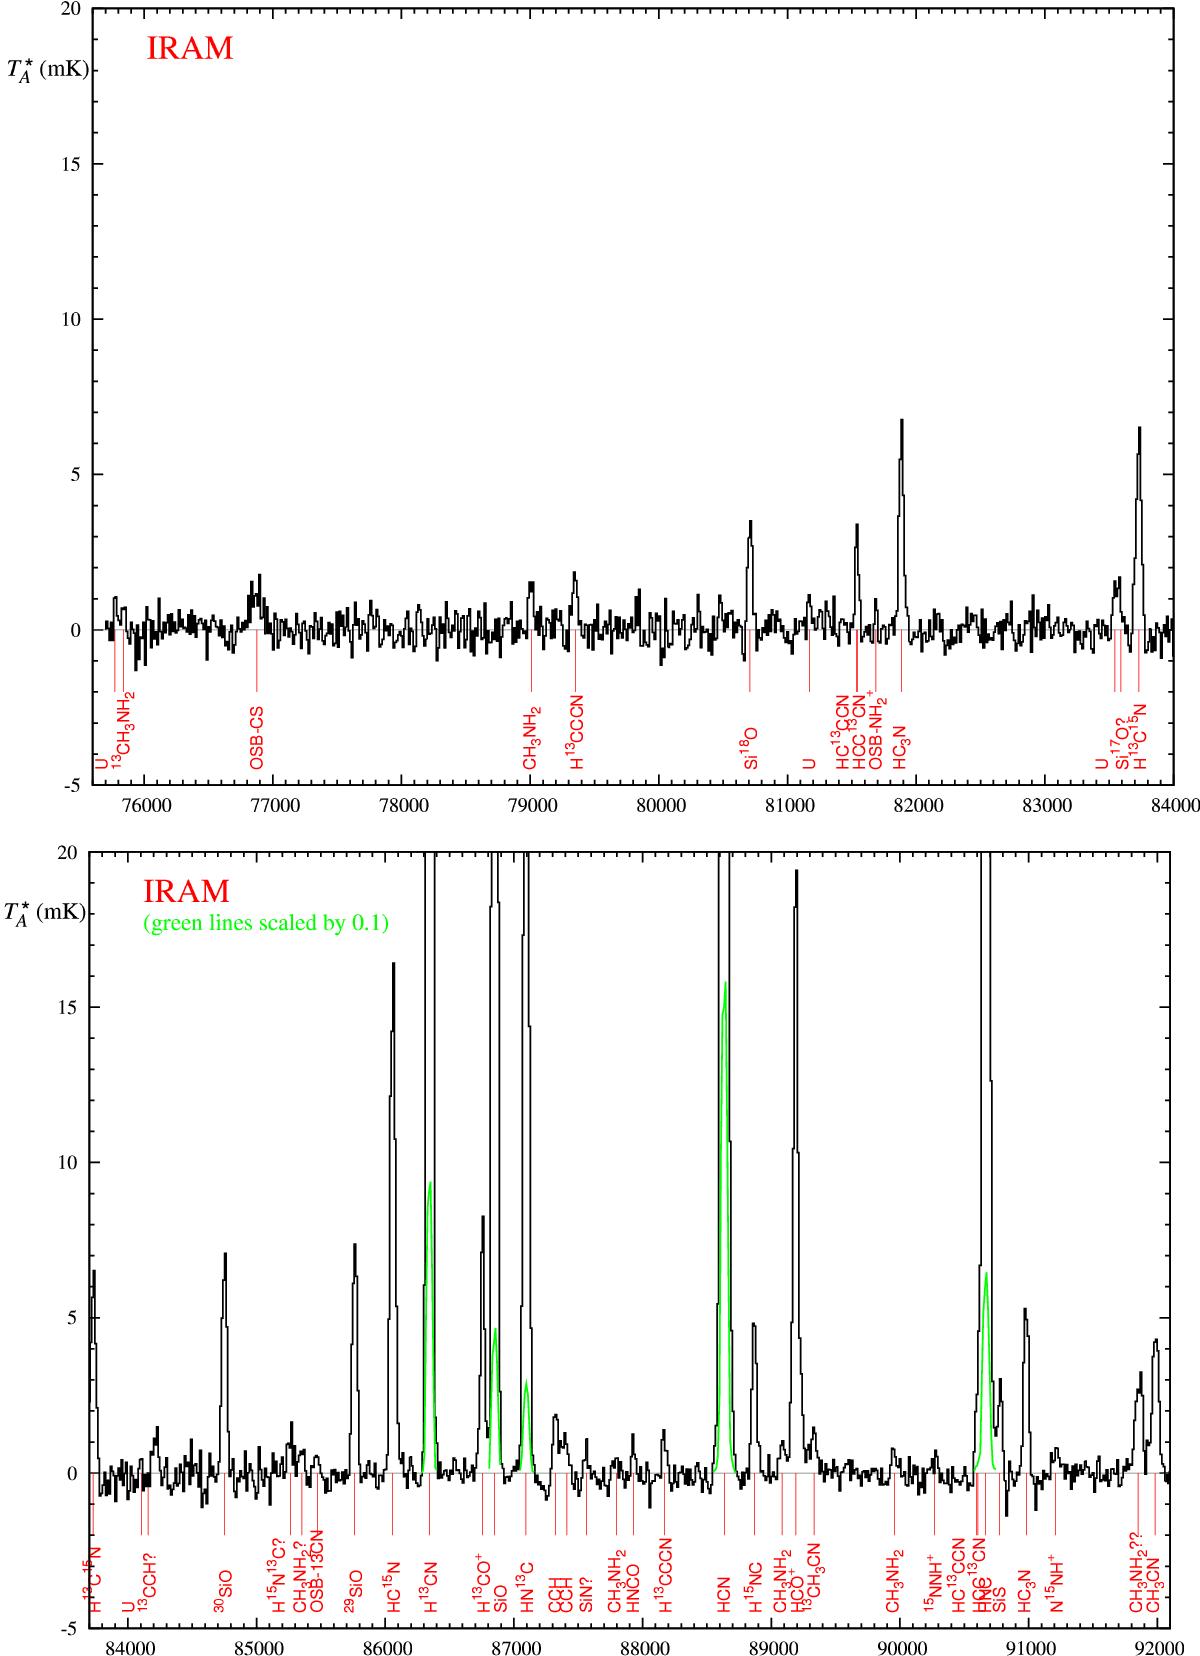
IRAM spectra (black) and assigned spectral features. Shown with green line are profiles of bright lines scaled by 0.1. The spectra are displayed in rest frequency (i.e. are corrected for VLSR = −10 km s-1) in MHz and in the antenna-temperature scale in mK.
This figure is made of several images, please see below:
Current usage metrics show cumulative count of Article Views (full-text article views including HTML views, PDF and ePub downloads, according to the available data) and Abstracts Views on Vision4Press platform.
Data correspond to usage on the plateform after 2015. The current usage metrics is available 48-96 hours after online publication and is updated daily on week days.
Initial download of the metrics may take a while.