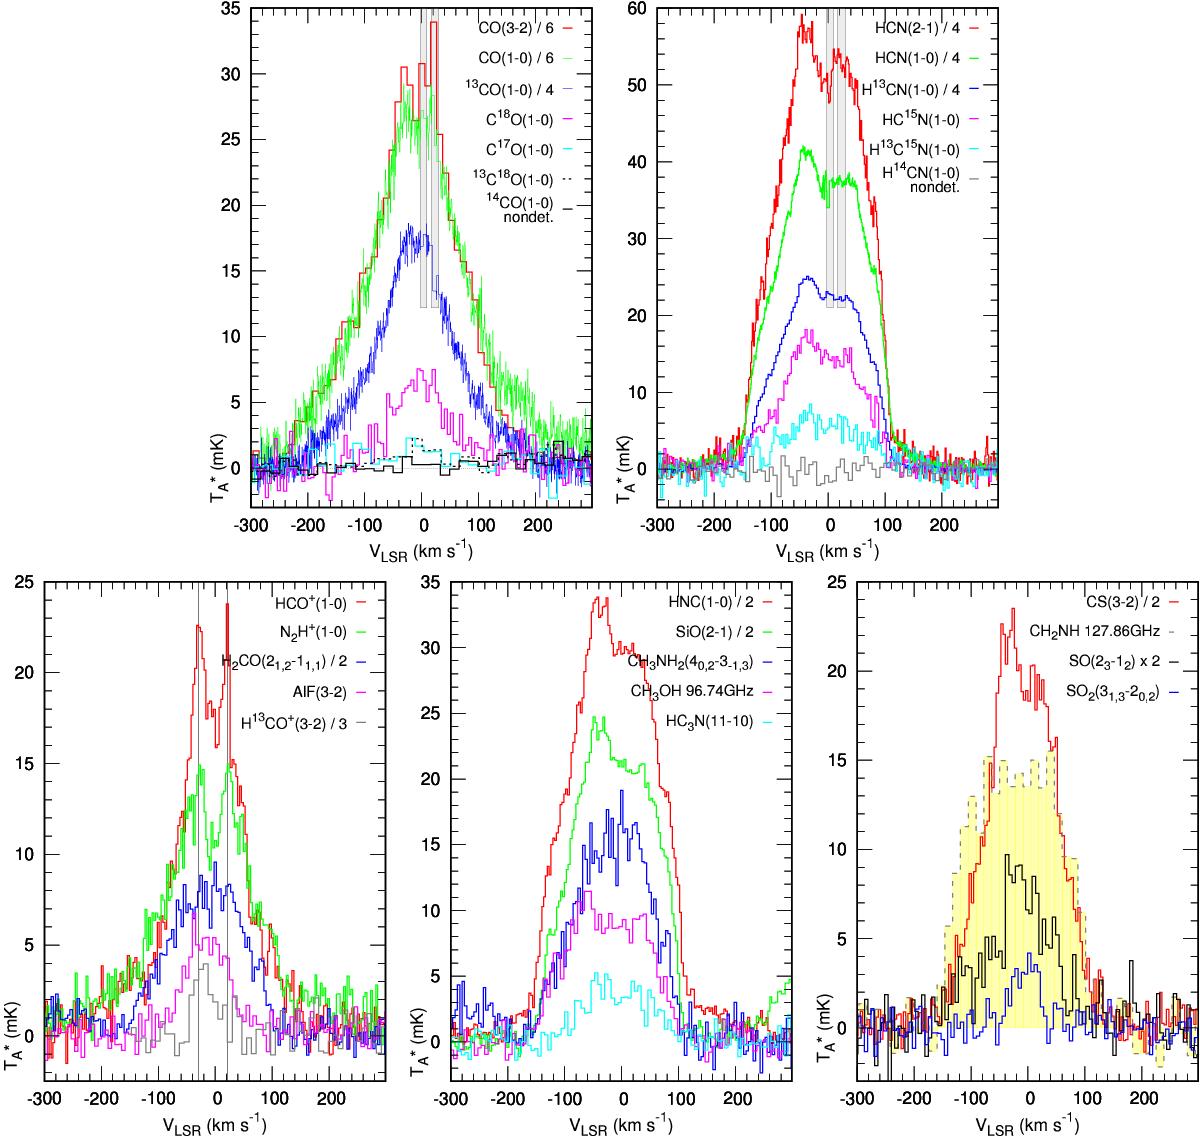
Fig. 3

Sample emission profiles. The species and transitions shown are indicated in the legends. For CH3OH and CH2NH, the approximate frequencies are given instead of quantum numbers. We could not assign unique quantum numbers to these features because they are blends of components that arise from transitions of different energy levels or species of different symmetry (e.g. E and A-type methanol). The shaded areas shown in the top panels mark the positions of interstellar features for which HCN and CO spectra were corrected. Some transitions have hyperfine splitting which, however, is insignificant compared to the total line width. For better presentation, some spectra were smoothed and scaled in intensity, as indicated in the legends.
Current usage metrics show cumulative count of Article Views (full-text article views including HTML views, PDF and ePub downloads, according to the available data) and Abstracts Views on Vision4Press platform.
Data correspond to usage on the plateform after 2015. The current usage metrics is available 48-96 hours after online publication and is updated daily on week days.
Initial download of the metrics may take a while.


