Fig. 2
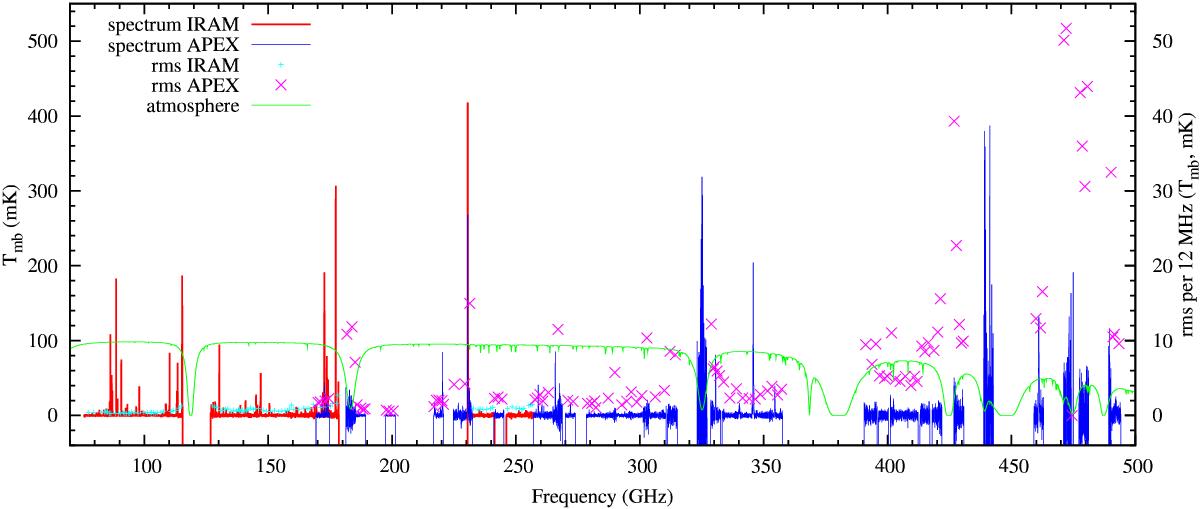
Spectral coverage of the data collected with IRAM (red) and APEX (blue). Data up to 500 GHz are shown but three more spectral ranges were covered at higher frequencies (Table A.1). Spectral binning is of 12 MHz. The spectra are in the Tmb scale shown in the left axis. The atmospheric transparency at the APEX site and at 1 mm of precipitable water vapour is shown (green) to illustrate the location of atmospheric windows (Pardo et al. 2001). Zero and full transparency (in %) correspond to values of 0 and 100 on the left axis. Note that the width and depth of the telluric absorption bands depend on the actual weather conditions and some observations were performed within the telluric bands at excellent weather. Plus symbols show the rms levels reached by APEX (bigger, purple) and IRAM (smaller, cyan). They are displayed in the Tmb scale shown in the right axis.
Current usage metrics show cumulative count of Article Views (full-text article views including HTML views, PDF and ePub downloads, according to the available data) and Abstracts Views on Vision4Press platform.
Data correspond to usage on the plateform after 2015. The current usage metrics is available 48-96 hours after online publication and is updated daily on week days.
Initial download of the metrics may take a while.