Fig. 1
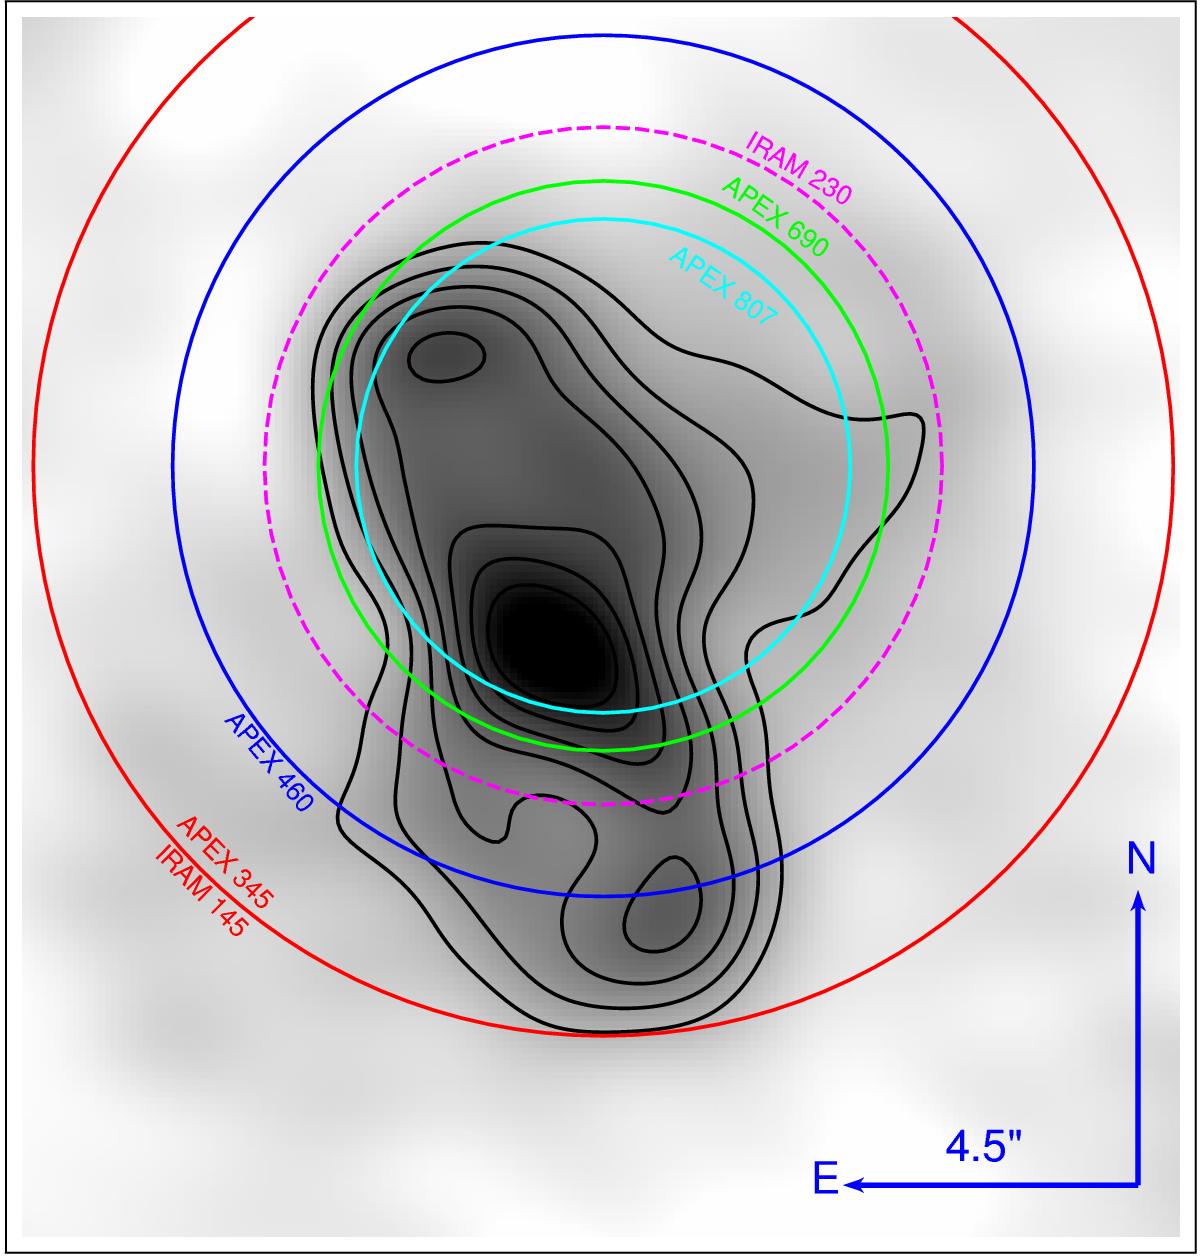
Representative telescope beams overplotted on a map obtained with the SMA and APEX in CO(3–2) (Kamiński et al. 2015a). The diameters of the circles correspond to FWHMs of the beams. From largest to smallest the circles mark beams at: 345 GHz of APEX and 145 GHz of IRAM (red); 460 GHz at APEX (blue); 230 GHz at IRAM (magenta, dashed); 690 GHz at APEX (green); and 810 GHz at APEX (cyan). The beams corresponding to APEX observations below 300 GHz and to IRAM observations below 100 GHz are larger than the map and are not shown. The centering of the beams corresponds to perfect antenna pointing. In reality, the observations could have been performed with pointing errors leading to offsets of up to 3′′.
Current usage metrics show cumulative count of Article Views (full-text article views including HTML views, PDF and ePub downloads, according to the available data) and Abstracts Views on Vision4Press platform.
Data correspond to usage on the plateform after 2015. The current usage metrics is available 48-96 hours after online publication and is updated daily on week days.
Initial download of the metrics may take a while.