Free Access
Fig. 9
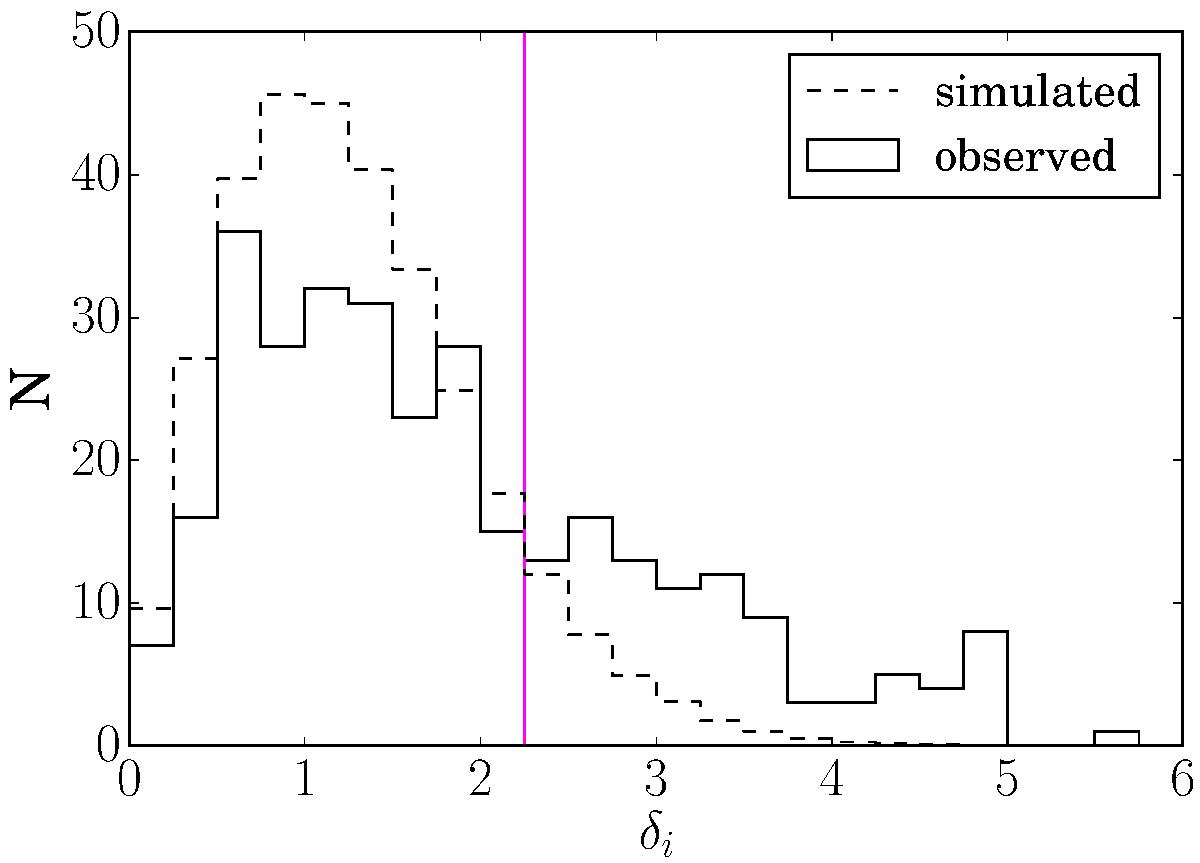
Distribution of the deviations among all the cluster members of A 520 (solid line) and the members of 1000 mock clusters (dashed line, normalised). The cut-off value of δi, shown with the solid magenta line, is determined from this plot as δi = 2.25.
Current usage metrics show cumulative count of Article Views (full-text article views including HTML views, PDF and ePub downloads, according to the available data) and Abstracts Views on Vision4Press platform.
Data correspond to usage on the plateform after 2015. The current usage metrics is available 48-96 hours after online publication and is updated daily on week days.
Initial download of the metrics may take a while.