Fig. 8
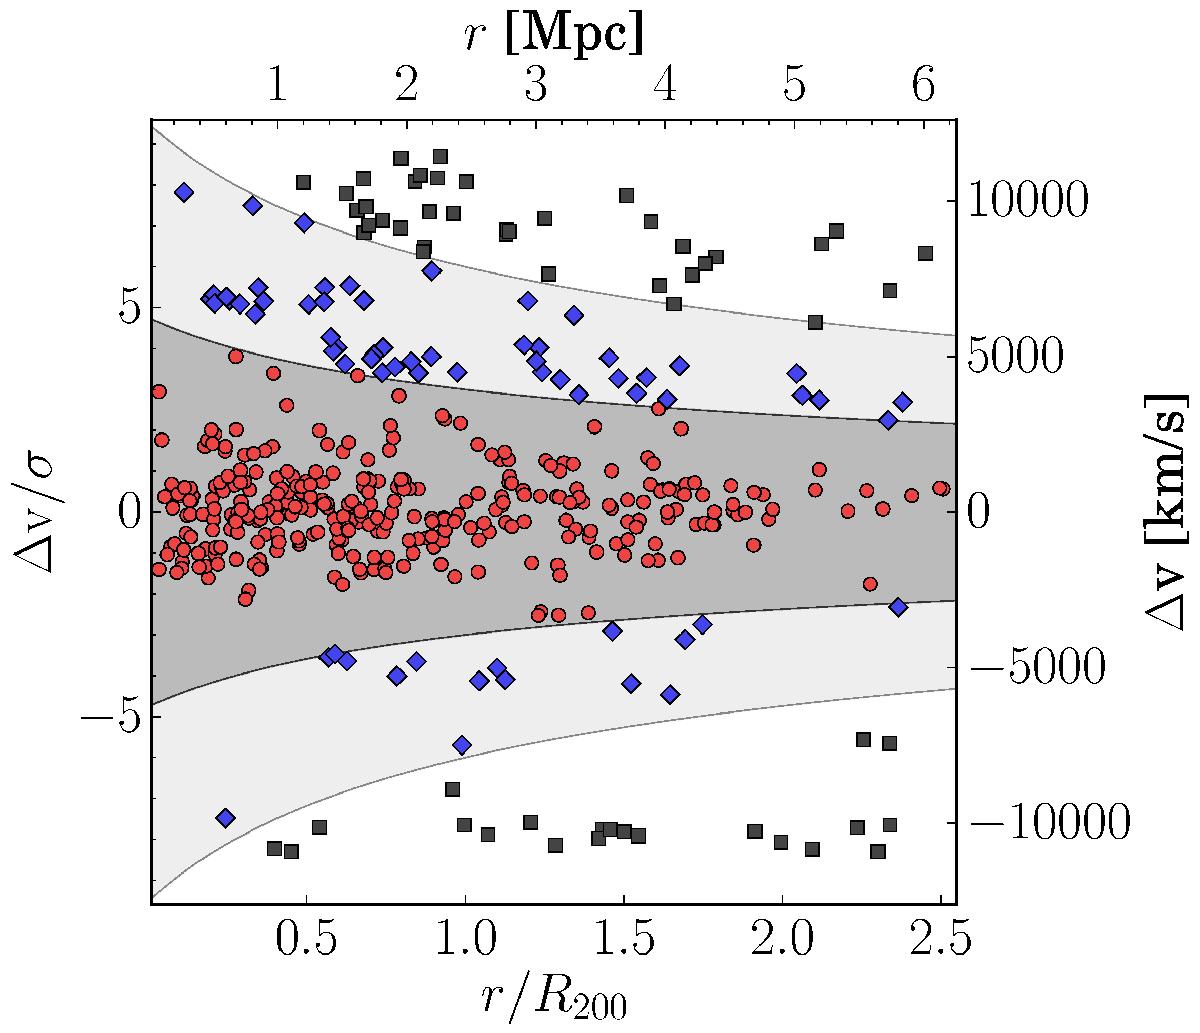
A projected phase-space diagram of A 520. The galaxies from the full data set are plotted as a function of the cluster-centric distance (normalised by the cluster’s R200) and peculiar velocity (normalised by the velocity dispersion of the cluster). The cluster members, according to the SIS analysis (see text for details) are plotted with red circles. Galaxies in the near field are shown with blue diamonds and non members with black squares. The curves outlining the regions populated by cluster members and near field galaxies are drawn according to Eq. (2) with normalisation of 3σ and 6σ at R200, respectively.
Current usage metrics show cumulative count of Article Views (full-text article views including HTML views, PDF and ePub downloads, according to the available data) and Abstracts Views on Vision4Press platform.
Data correspond to usage on the plateform after 2015. The current usage metrics is available 48-96 hours after online publication and is updated daily on week days.
Initial download of the metrics may take a while.