Fig. 5
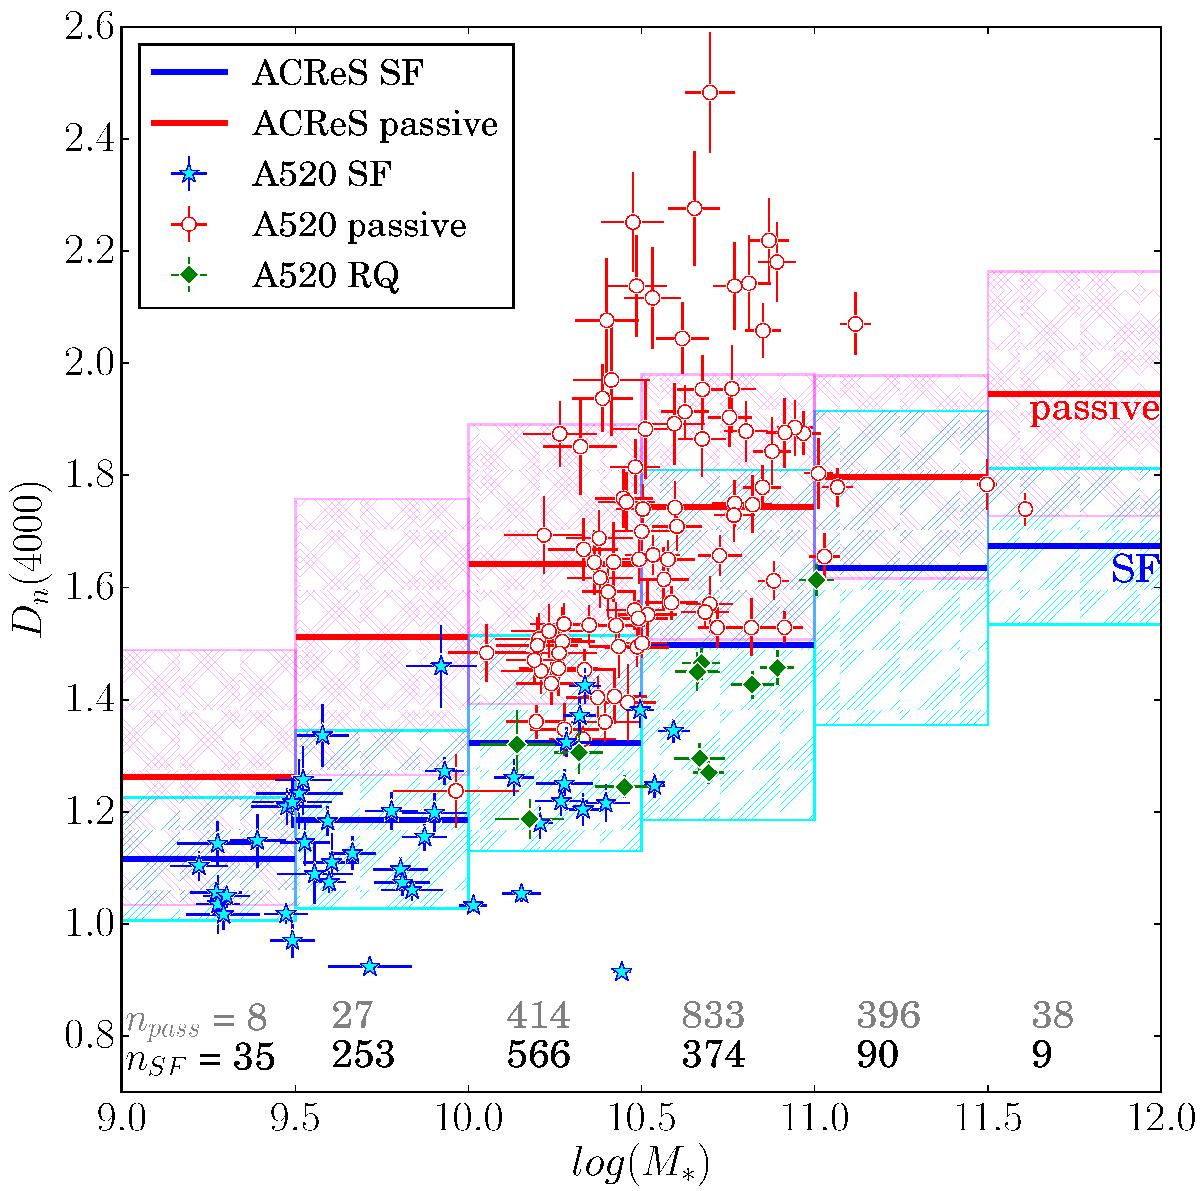
Strength of the 4000 Å break as a function of stellar mass. The mean Dn(4000) value for the star forming galaxies in the comparison clusters, in bins of stellar mass, is shown with the thick blue lines. The thick red lines show the same for the passive members of the comparison clusters. The shaded regions in cyan and magenta show the standard deviation around the mean values for the star forming and passive galaxies, respectively. The A 520 galaxies are split into three groups. The star forming ones are shown with blue stars, the passive ones with empty red circles and the recently quenched ones with green diamonds. The last group contains the passive galaxies with Dn(4000) lower than the average of the star forming ACReS galaxies with the same stellar mass. The number of passive and star forming galaxies in the comparison clusters is indicated in each stellar-mass bin.
Current usage metrics show cumulative count of Article Views (full-text article views including HTML views, PDF and ePub downloads, according to the available data) and Abstracts Views on Vision4Press platform.
Data correspond to usage on the plateform after 2015. The current usage metrics is available 48-96 hours after online publication and is updated daily on week days.
Initial download of the metrics may take a while.