Fig. 3
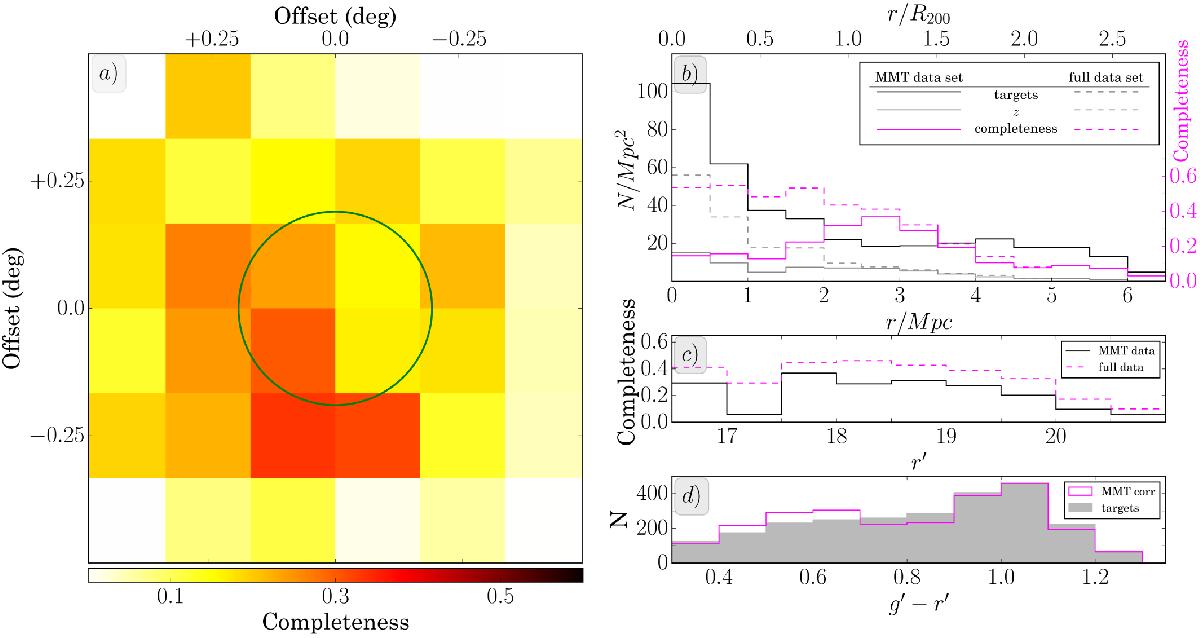
Completeness of our survey defined as the fraction of all possible targets for which z was successfully estimated. Panel a: 2D distribution of the completeness on the sky for the MMT data set. The green circle has a radius equal to R200 of the cluster (derived in Sect. 5.1). Panel b: completeness, and number density distribution, of the MMT survey and the full data set as a function of cluster-centric distance. Panel c: completeness as a function of r′ magnitude. Panel d: effect of the completeness correction calculated from panel c. The filled, grey histogram shows the g′−r′ colour distribution of all the potential targets. The solid magenta line shows the colour distribution of the galaxies with z estimate from the MMT data set corrected for completeness.
Current usage metrics show cumulative count of Article Views (full-text article views including HTML views, PDF and ePub downloads, according to the available data) and Abstracts Views on Vision4Press platform.
Data correspond to usage on the plateform after 2015. The current usage metrics is available 48-96 hours after online publication and is updated daily on week days.
Initial download of the metrics may take a while.