Fig. 14
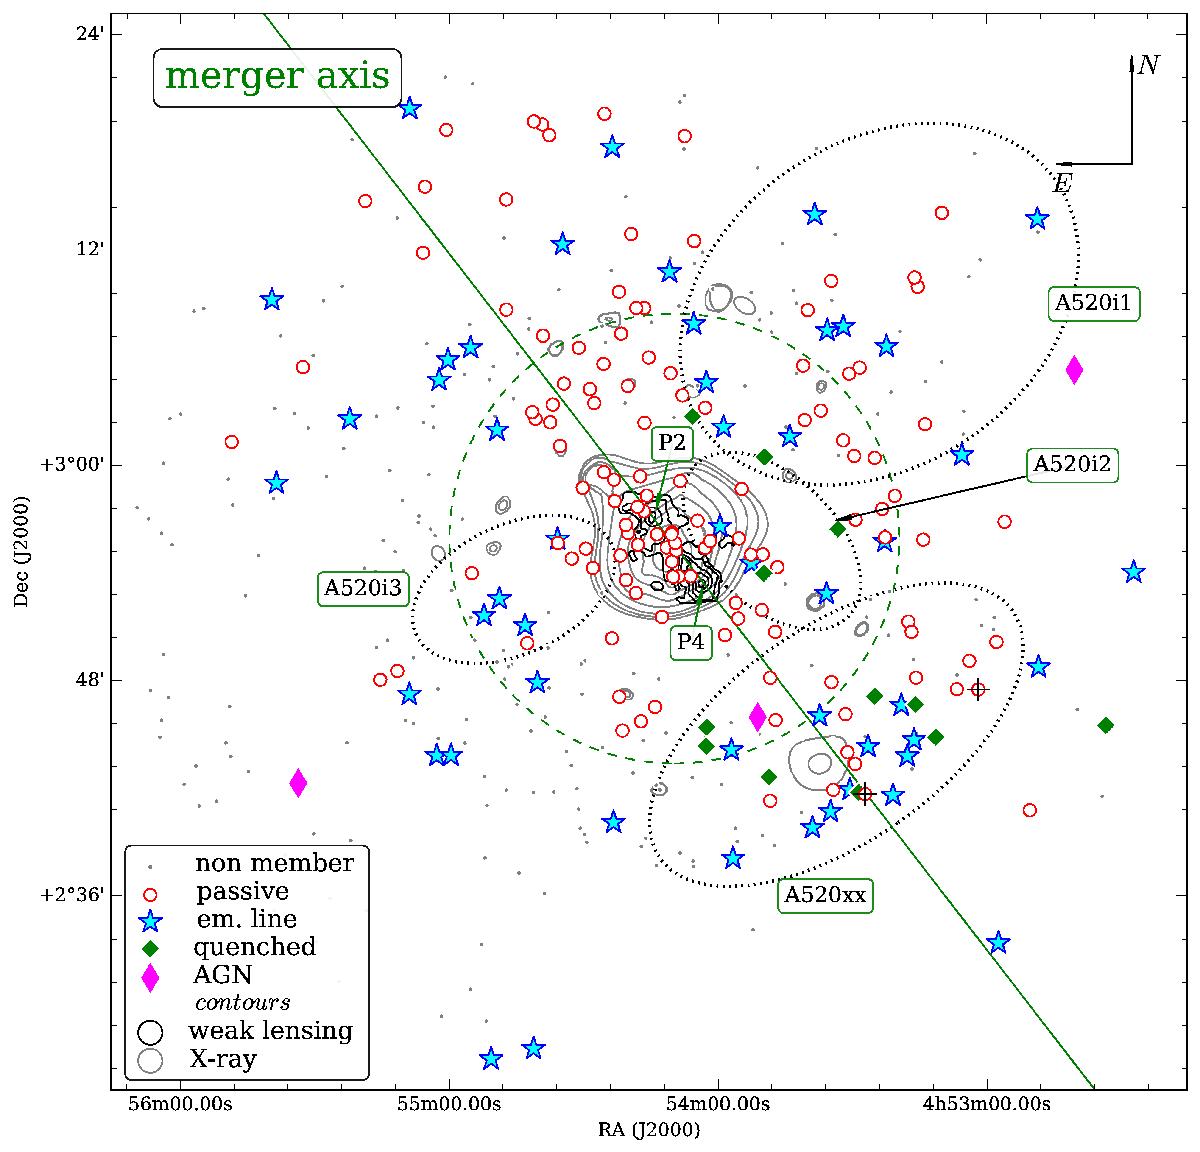
Distribution on the sky of all galaxies from the MMT data set. The small grey dots are galaxies with z; not members of A 520. All the other symbols show A 520 members. The red circles are passive galaxies. The large magenta diamonds are AGNs and the cyan stars are star forming galaxies. The small green diamonds are recently quenched galaxies. The black contours in the centre show the mass distribution from Jee et al. (2014), the grey contours show the X-ray emission from XMM-Newton. The green dashed circle has a radius equal to the R200 of the cluster. The solid green line connects the P2 and P4 mass concentrations from Jee et al. (2014) and indicates the approximate orientation of the merger axis. The black dotted ellipses with name tags are the DS recovered substructures, the same as in Fig. 10. The addition of A 520xx is discussed in the text.
Current usage metrics show cumulative count of Article Views (full-text article views including HTML views, PDF and ePub downloads, according to the available data) and Abstracts Views on Vision4Press platform.
Data correspond to usage on the plateform after 2015. The current usage metrics is available 48-96 hours after online publication and is updated daily on week days.
Initial download of the metrics may take a while.