Fig. 13
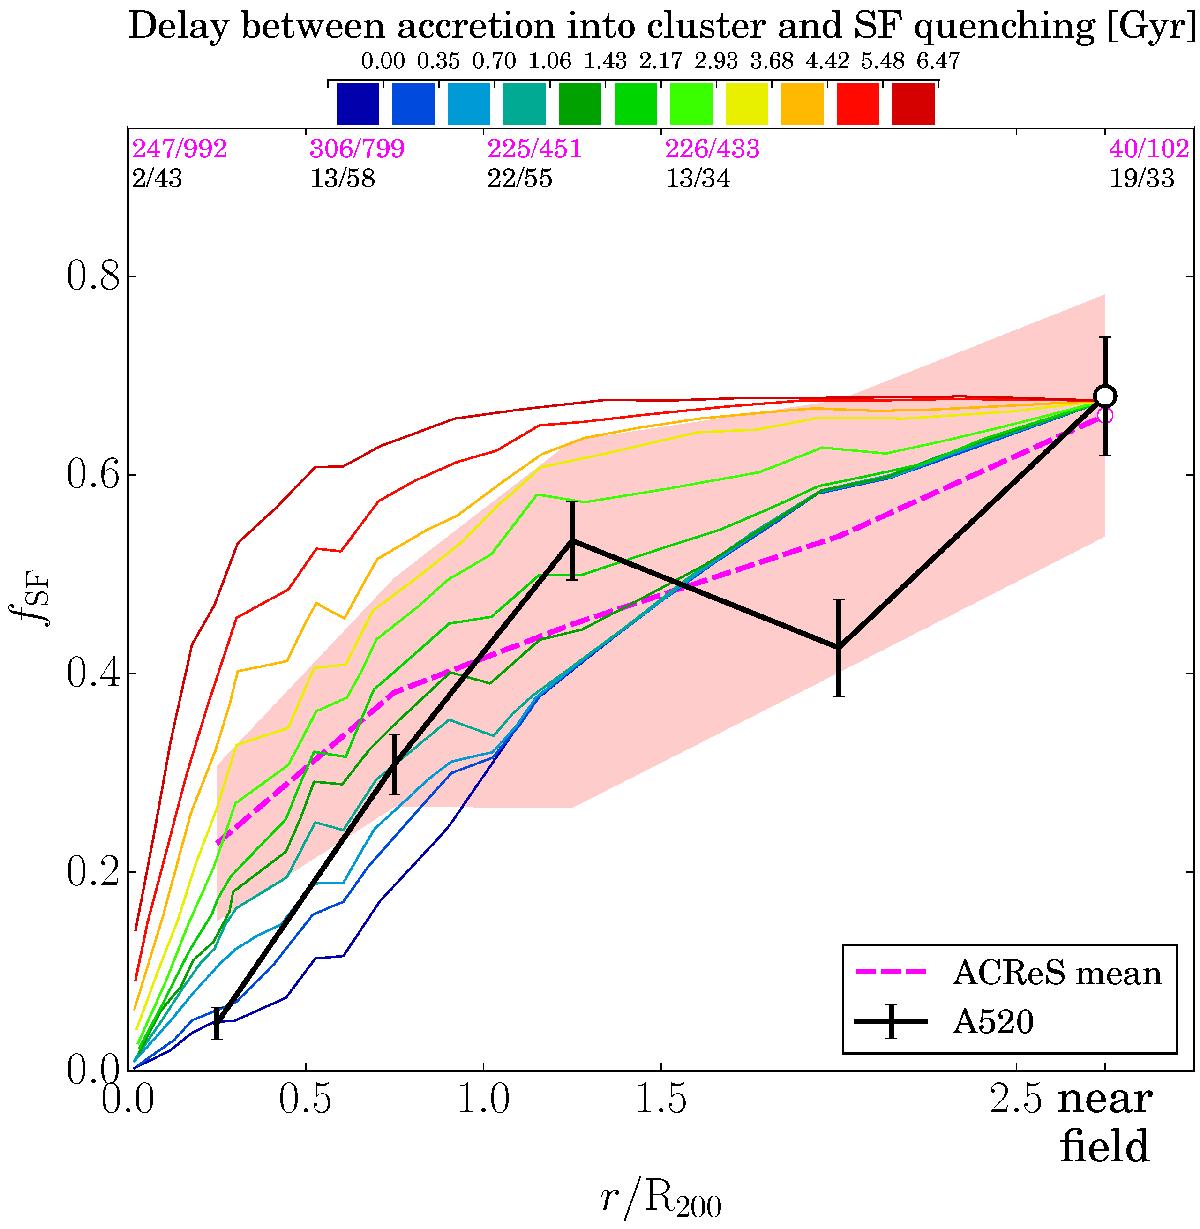
Completeness-corrected fractions of star forming galaxies as a function of cluster-centric distance. The black solid line shows A 520. The thick dashed magenta line shows the mean of the ten clusters from the comparison sample. The region shaded in magenta shows the spread (±1σ) among the individual clusters. The outermost point, indicated with a large circle, shows fSF in the near field region. The last radial bin is double the size of the inner ones due to a low number of points. The numbers in each radial bin show the number of galaxies in that bin before correction for completeness (number of star forming galaxies NSF/total number of galaxies Nall). The magenta and black numbers show the comparison sample and A 520, respectively. The thin lines of different colour show the expected fSF-radius relation from observations of 75 massive clusters in the Millennium simulation. The star formation in the infalling galaxies is quenched upon passing through R200 of the cluster for the first time, with a delay indicated by the different colour, according to the colour bar on top of the plot. fSF in the infall region of the simulated clusters is normalised to the median fSF in the near field of the ten comparison clusters.
Current usage metrics show cumulative count of Article Views (full-text article views including HTML views, PDF and ePub downloads, according to the available data) and Abstracts Views on Vision4Press platform.
Data correspond to usage on the plateform after 2015. The current usage metrics is available 48-96 hours after online publication and is updated daily on week days.
Initial download of the metrics may take a while.