Fig. 11
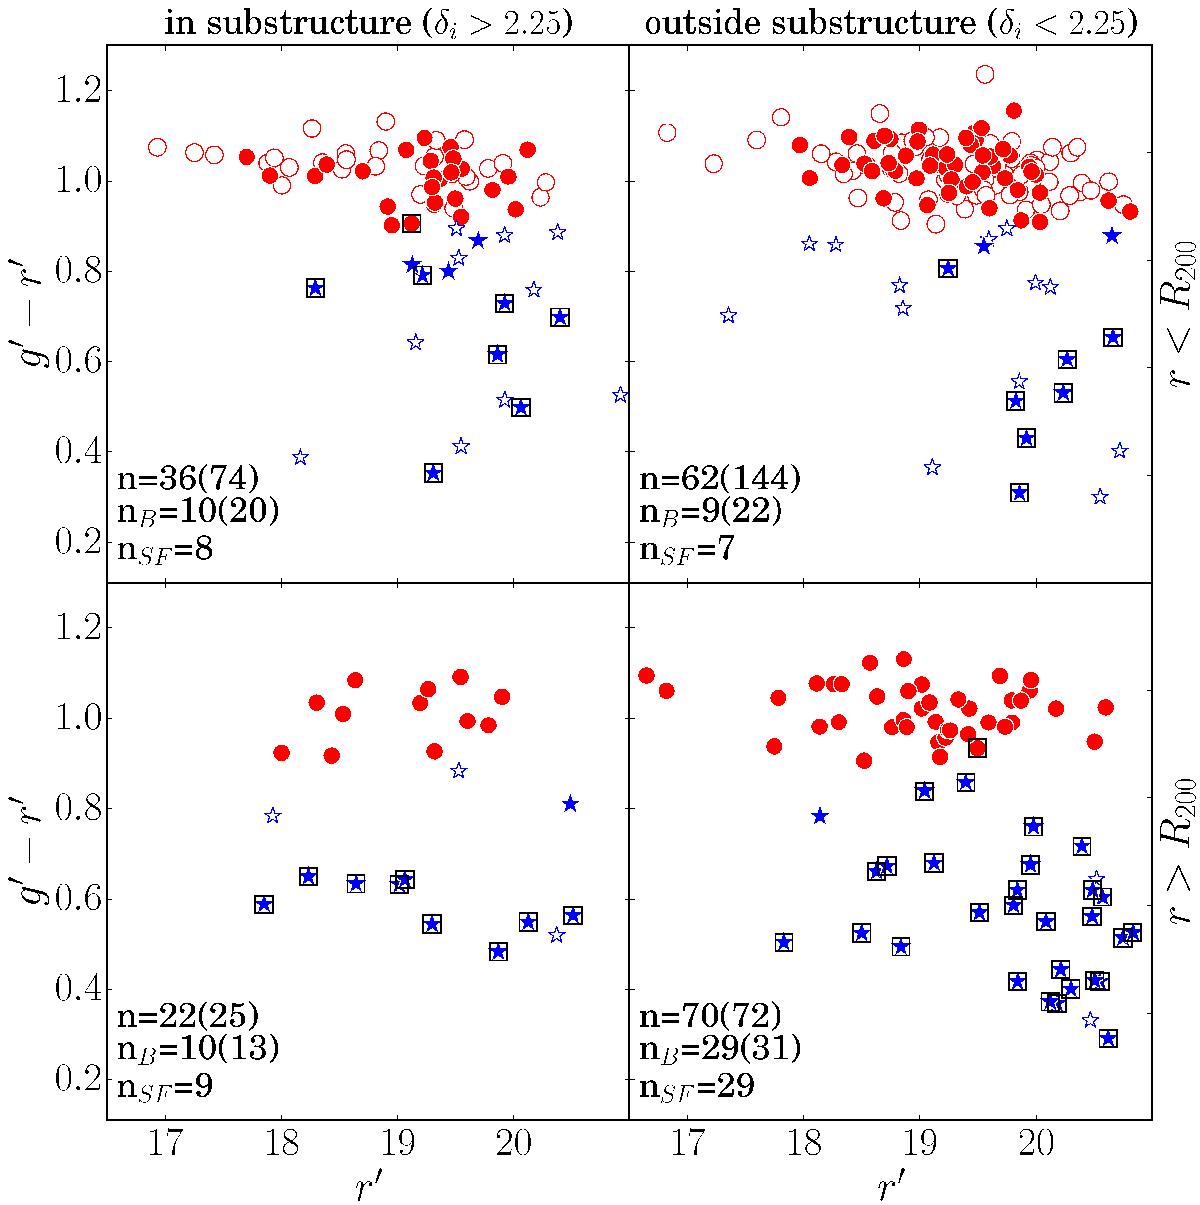
Colour magnitude diagrams for all the galaxies in the full data set. The left column shows galaxies in substructure, the right one outside substructure. The top row shows galaxies within R200 and the bottom row shows glaxies outside that radius. The galaxies from G08 are shown with empty symbols and the MMT galaxies with full ones. The blue and red galaxies are indicated with blue stars and red circles, respectively. The galaxies with emission lines have a black square around their symbols. The total number of galaxies in each quadrant n is indicated for the MMT data set and in brackets for the full data set. Also indicated are the total number of blue galaxies nB for the MMT data set (full data set), and the total number of star forming galaxies nSF.
Current usage metrics show cumulative count of Article Views (full-text article views including HTML views, PDF and ePub downloads, according to the available data) and Abstracts Views on Vision4Press platform.
Data correspond to usage on the plateform after 2015. The current usage metrics is available 48-96 hours after online publication and is updated daily on week days.
Initial download of the metrics may take a while.