Fig. 10
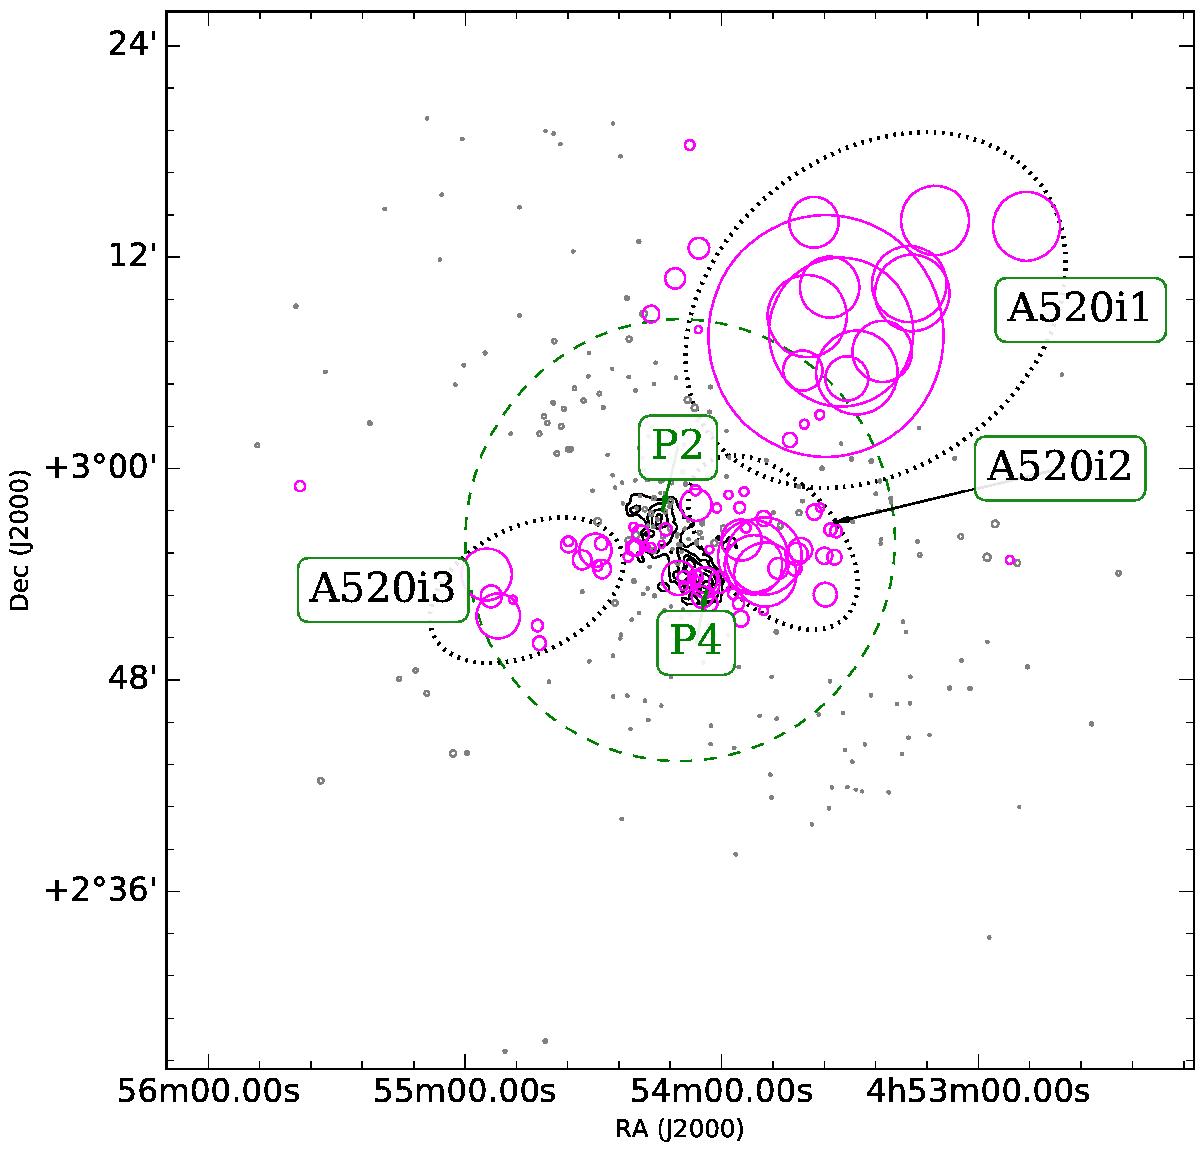
Results from the DS test. Each galaxy is represented with a circle with radius proportional to eδ. The ones with δi ≤ 2.25 are shown with grey circles, the ones with δi> 2.25 with magenta circles. The weak lensing mass density contours from Jee et al. (2014) are shown in black and the centres of the main mass concentrations (P2 and P4) are annotated. The green dashed circle has a radius equal to R200. The recovered structures are outlined with black dotted lines.
Current usage metrics show cumulative count of Article Views (full-text article views including HTML views, PDF and ePub downloads, according to the available data) and Abstracts Views on Vision4Press platform.
Data correspond to usage on the plateform after 2015. The current usage metrics is available 48-96 hours after online publication and is updated daily on week days.
Initial download of the metrics may take a while.