Free Access
Fig. 1
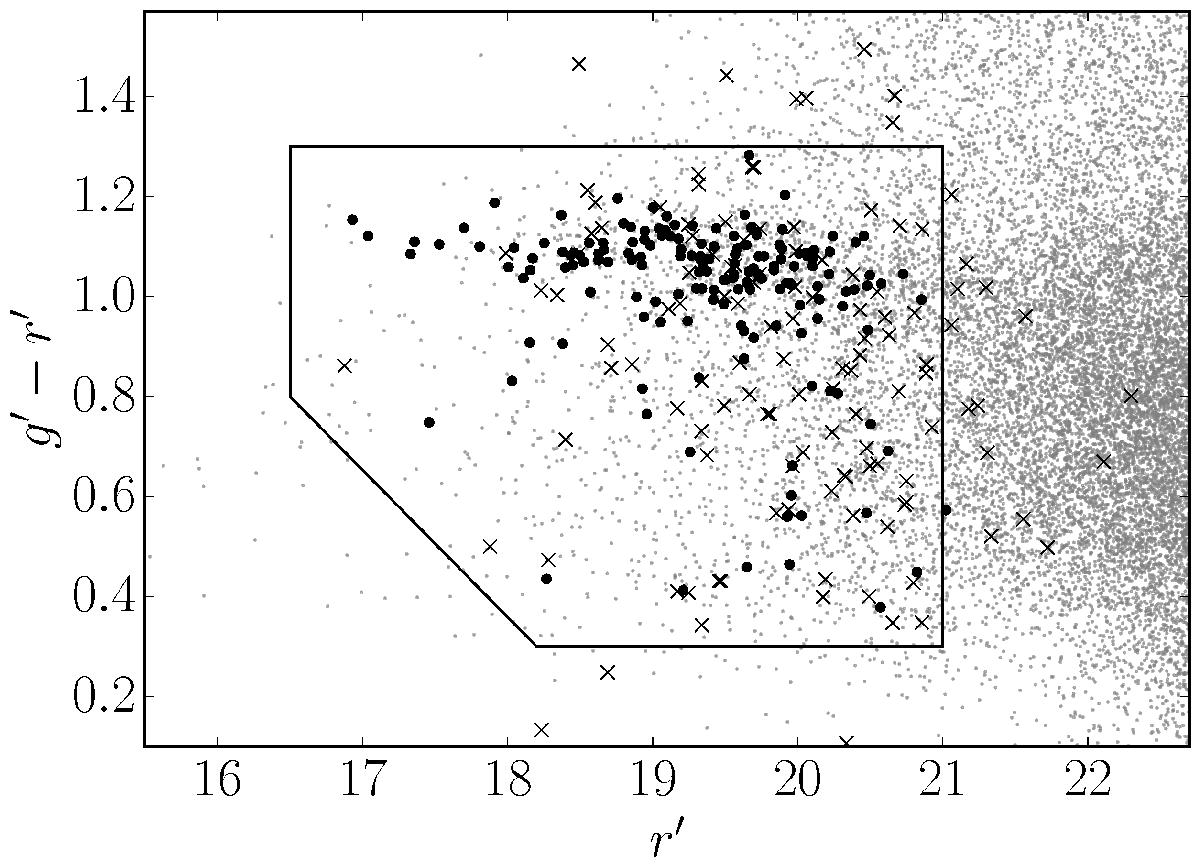
Selection of targets by optical colour and magnitude. The grey points are all the extended sources extracted from the CFHT images. The black dots and crosses are the spectroscopically confirmed members and non-members, respectively. The black polygon shows the region from which we select our targets.
Current usage metrics show cumulative count of Article Views (full-text article views including HTML views, PDF and ePub downloads, according to the available data) and Abstracts Views on Vision4Press platform.
Data correspond to usage on the plateform after 2015. The current usage metrics is available 48-96 hours after online publication and is updated daily on week days.
Initial download of the metrics may take a while.