Fig. 6
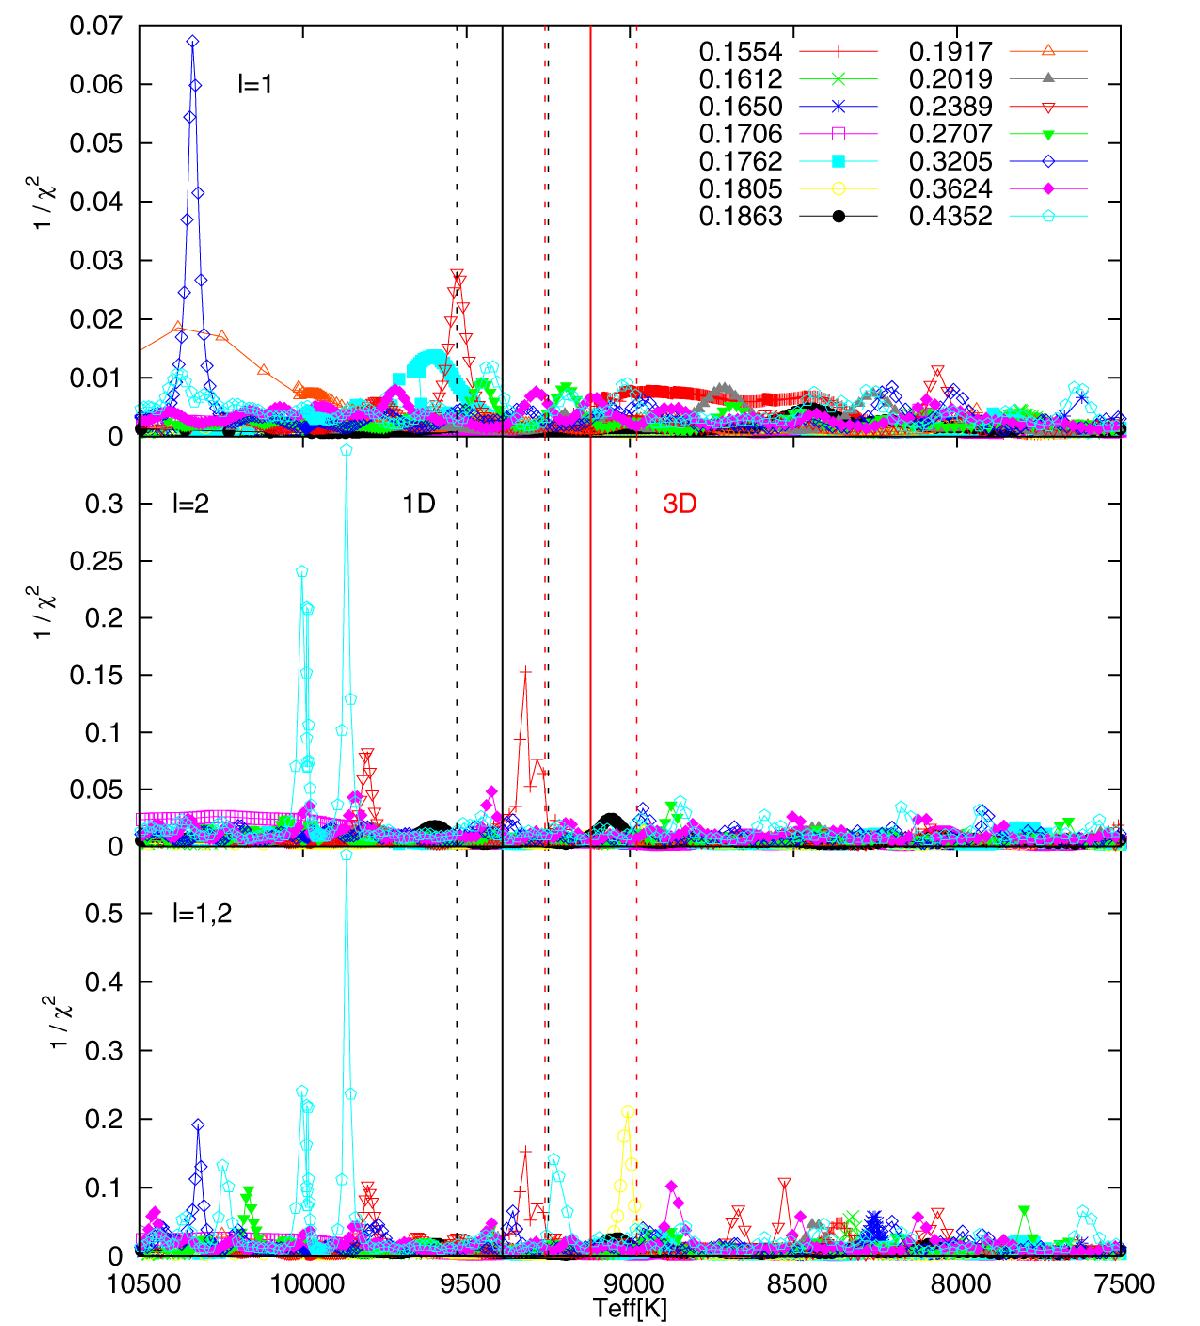
Inverse of the quality function of the period fit considering ℓ = 1 (top panel), ℓ = 2 (middle panel), and ℓ = 1,2 (bottom panel) versus Teff for J1840 (see text for details). The vertical strips depict the spectroscopic Teff (solid vertical lines) and their uncertainties (dashed vertical lines) for the 1D (dark gray lines) and 3D models (red lines).
Current usage metrics show cumulative count of Article Views (full-text article views including HTML views, PDF and ePub downloads, according to the available data) and Abstracts Views on Vision4Press platform.
Data correspond to usage on the plateform after 2015. The current usage metrics is available 48-96 hours after online publication and is updated daily on week days.
Initial download of the metrics may take a while.