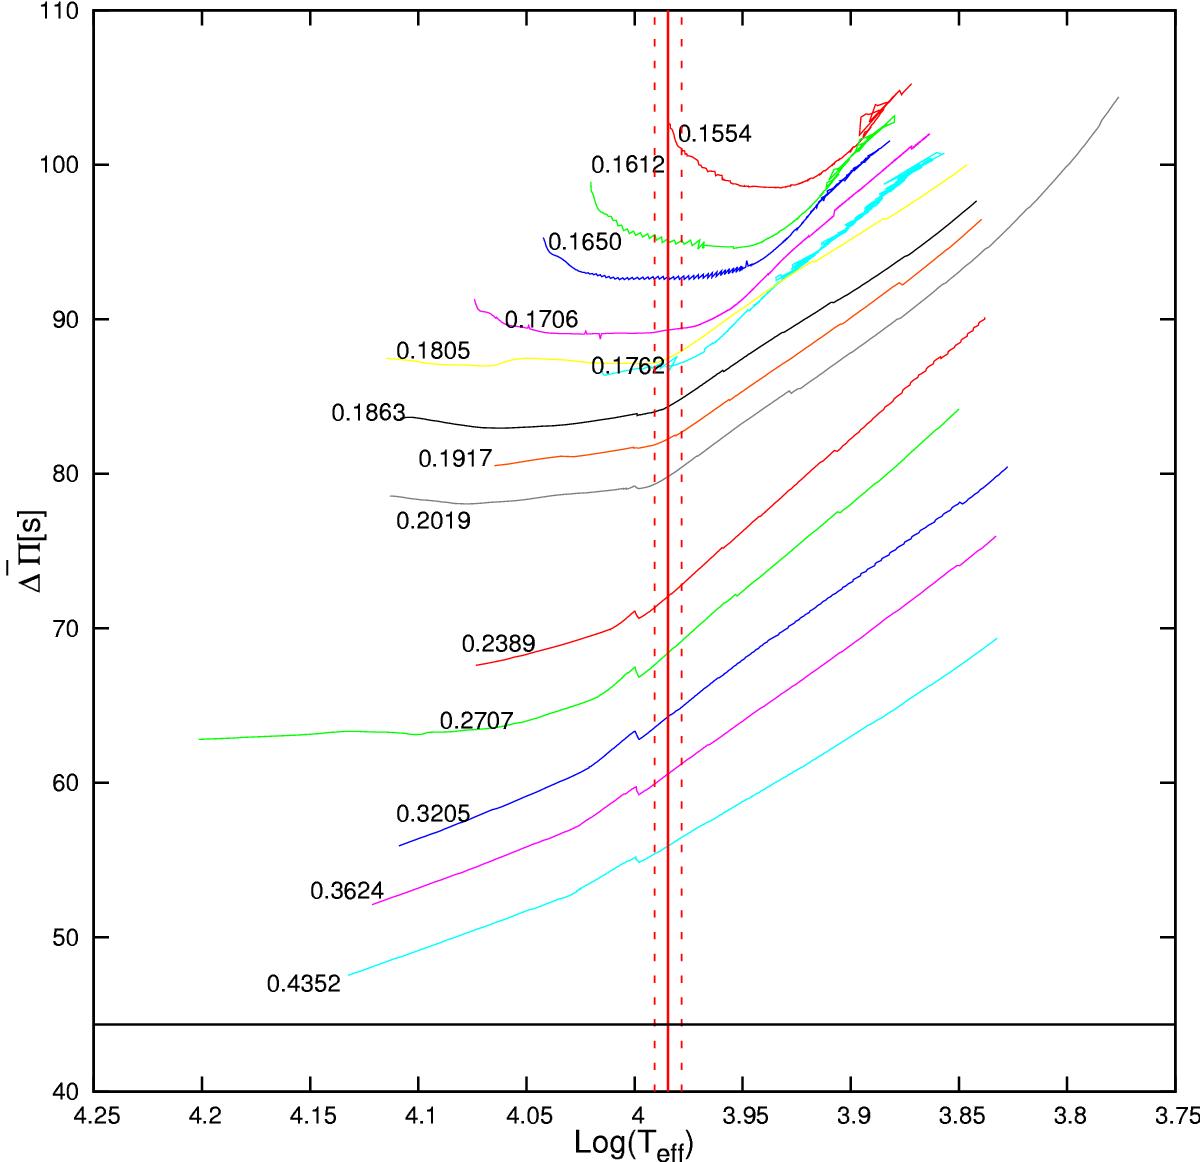
Fig. 4
Average of the computed dipole (ℓ = 1) period spacings (![]() ) assessed in the range of the periods observed in J1518, corresponding to each WD model sequence considered in this work, in terms of the logarithm of the effective temperature. Numbers along each curve denote the stellar mass (in solar units). The observed period spacing derived for J1518 is depicted with a horizontal solid line. We also indicate the Teff (vertical solid line) in the 3D model, together with its uncertainties (vertical dashed lines).
) assessed in the range of the periods observed in J1518, corresponding to each WD model sequence considered in this work, in terms of the logarithm of the effective temperature. Numbers along each curve denote the stellar mass (in solar units). The observed period spacing derived for J1518 is depicted with a horizontal solid line. We also indicate the Teff (vertical solid line) in the 3D model, together with its uncertainties (vertical dashed lines).
Current usage metrics show cumulative count of Article Views (full-text article views including HTML views, PDF and ePub downloads, according to the available data) and Abstracts Views on Vision4Press platform.
Data correspond to usage on the plateform after 2015. The current usage metrics is available 48-96 hours after online publication and is updated daily on week days.
Initial download of the metrics may take a while.