Fig. 7
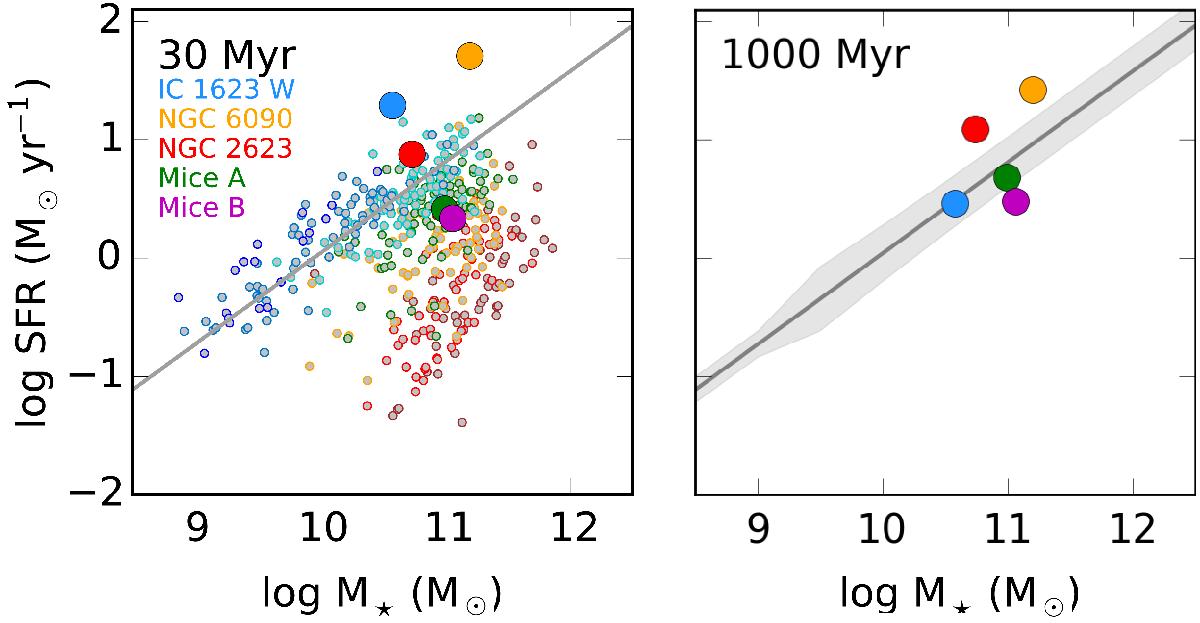
Global average SFR versus the galaxy stellar mass for the four mergers of our sample at the two different time scales (tSF = 30 Myr (left) and 1 Gyr (right)). For comparison, we show the MSSF (grey line) as derived by González Delgado et al. (2016) using late type Sc spirals of CALIFA and using a tSF = 30 Myr. In the left panel, all the galaxies are shown with small dots, colour-coded by Hubble type following González Delgado et al. (2016), with a brown to blue colour palette that represents Hubble types from ellipticals to late spirals. In the right panel the light grey shaded regions indicate the 1σ dispersion of the sample. The positions of the Mice, the pre-merger LIRGs IC 1623 W and NGC 6090, and NGC 2623, are shown with solid circles following the same colour coding as in previous figures.
Current usage metrics show cumulative count of Article Views (full-text article views including HTML views, PDF and ePub downloads, according to the available data) and Abstracts Views on Vision4Press platform.
Data correspond to usage on the plateform after 2015. The current usage metrics is available 48-96 hours after online publication and is updated daily on week days.
Initial download of the metrics may take a while.