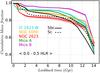
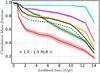
Fig. 4
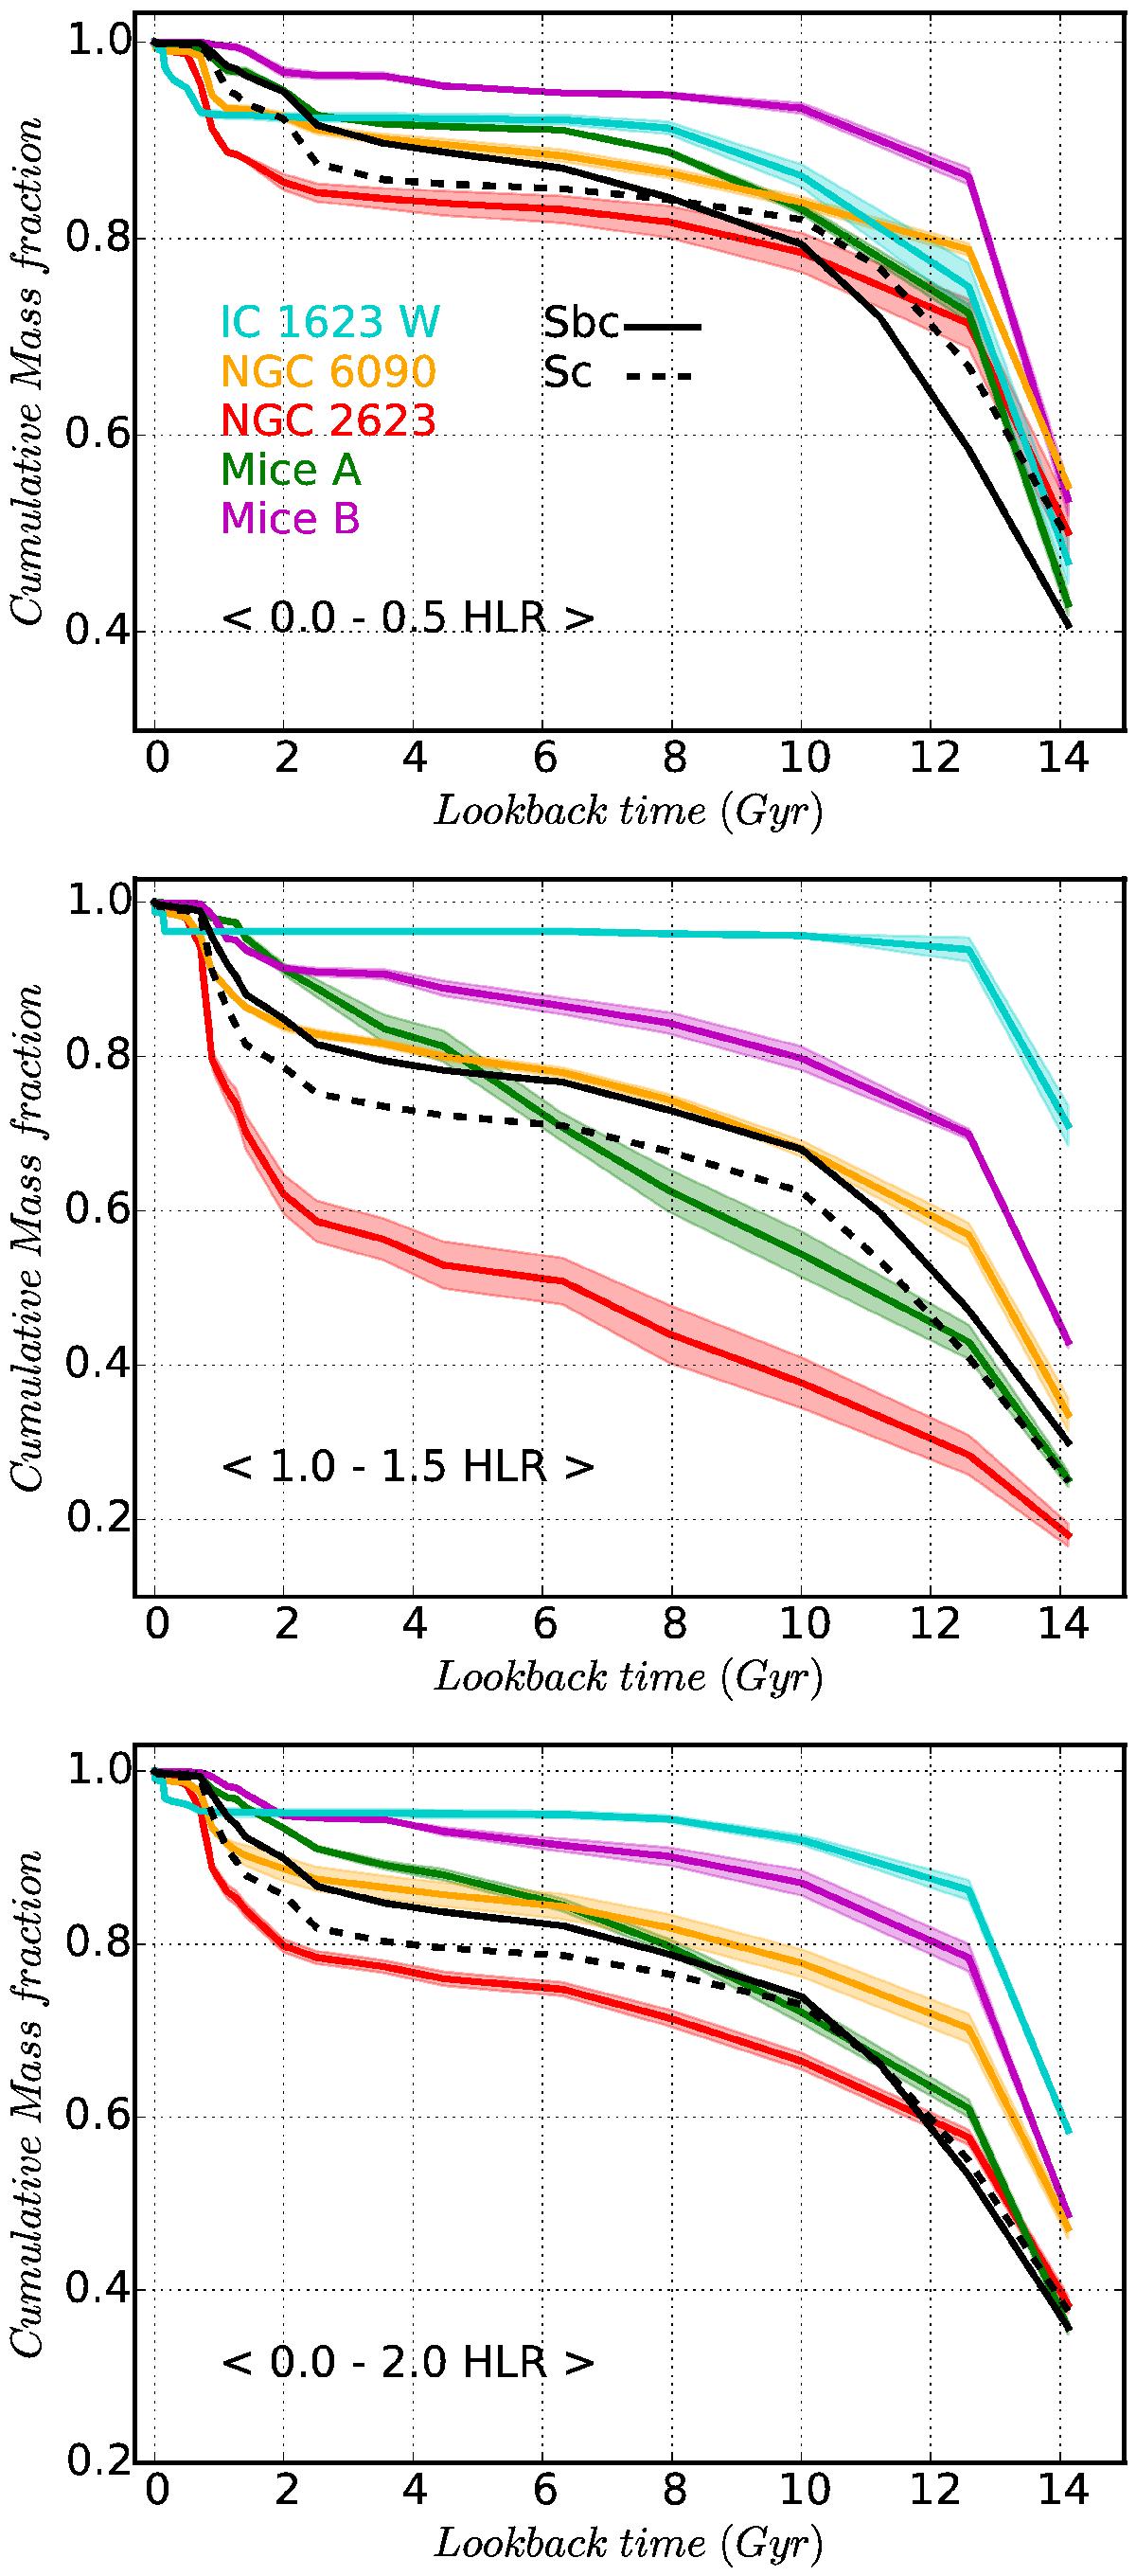
Cumulative mass growth for the inner 0.5 HLR (upper panel), between 1 and 1.5 HLR (middle panel), and the central 2 HLR (bottom panel). The uncertainties are shaded in light colours, calculated as the dispersion in the profiles due to ±0.1 HLR variations in the radial distance in the 0–0.5 HLR and 1–1.5 HLR regions, and ±0.5 HLR for the global 0–2 HLR region. The merger galaxies are colour coded, and they are compared with the results obtained for Sbc (black line) and Sc (dashed-black line) galaxies.
Current usage metrics show cumulative count of Article Views (full-text article views including HTML views, PDF and ePub downloads, according to the available data) and Abstracts Views on Vision4Press platform.
Data correspond to usage on the plateform after 2015. The current usage metrics is available 48-96 hours after online publication and is updated daily on week days.
Initial download of the metrics may take a while.