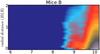
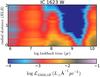
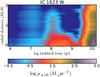
Fig. 2
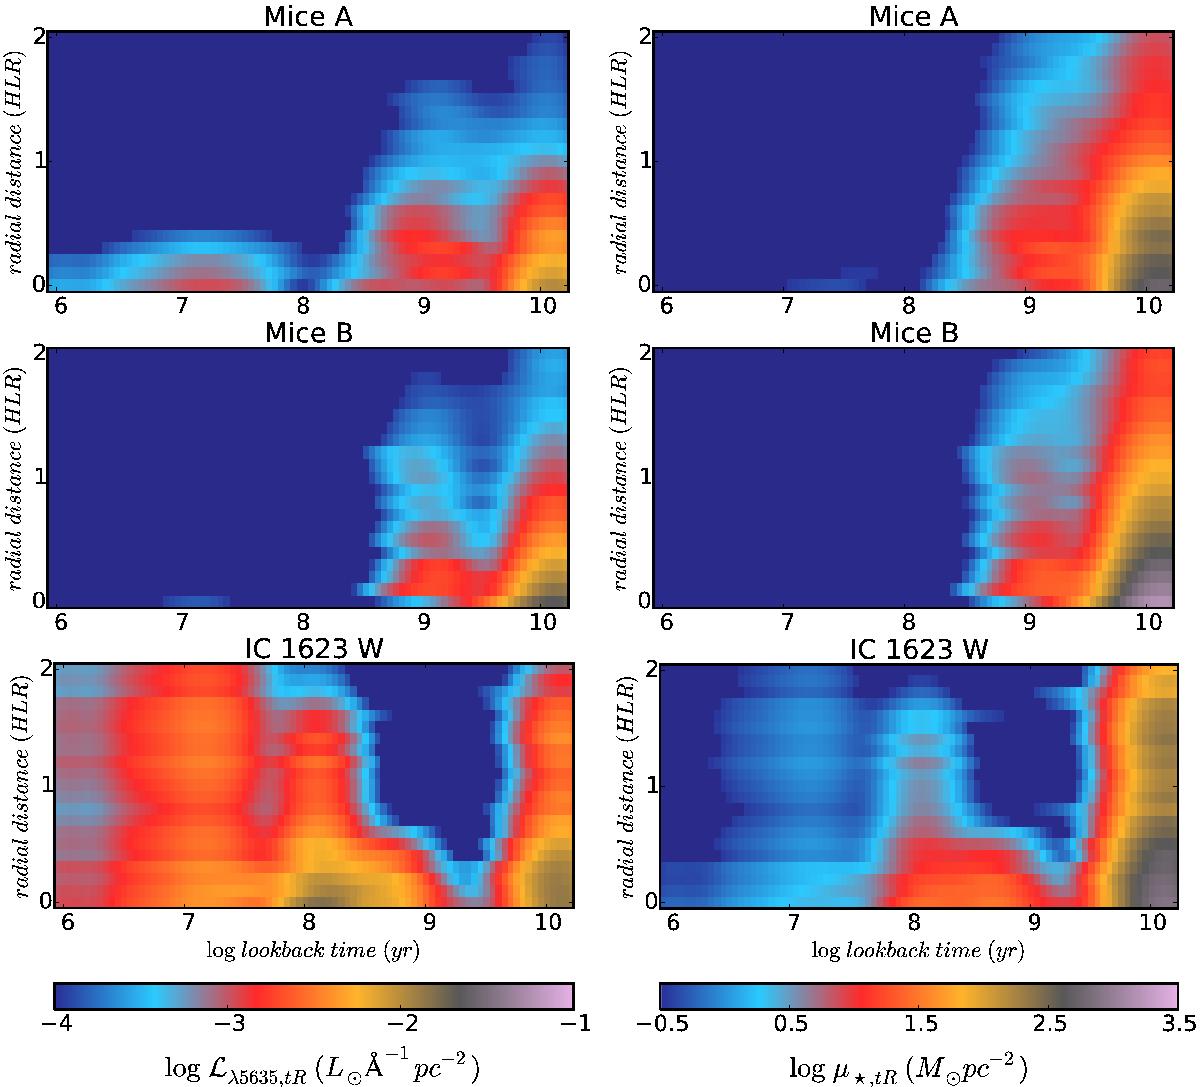
R × t diagrams showing the radially averaged distribution of the mass and light as a function of the distance (in HLR units) from the nucleus and lookback time (in log units). The intensity of the map shows: stellar mass formed per unit area (M⊙ pc-2; right panels), and luminosity at 5635 Å per unit area (L⊙ Å-1 pc-2; left panels). From top to bottom: Mice A, Mice B, IC 1623 W.
Current usage metrics show cumulative count of Article Views (full-text article views including HTML views, PDF and ePub downloads, according to the available data) and Abstracts Views on Vision4Press platform.
Data correspond to usage on the plateform after 2015. The current usage metrics is available 48-96 hours after online publication and is updated daily on week days.
Initial download of the metrics may take a while.