Fig. 3
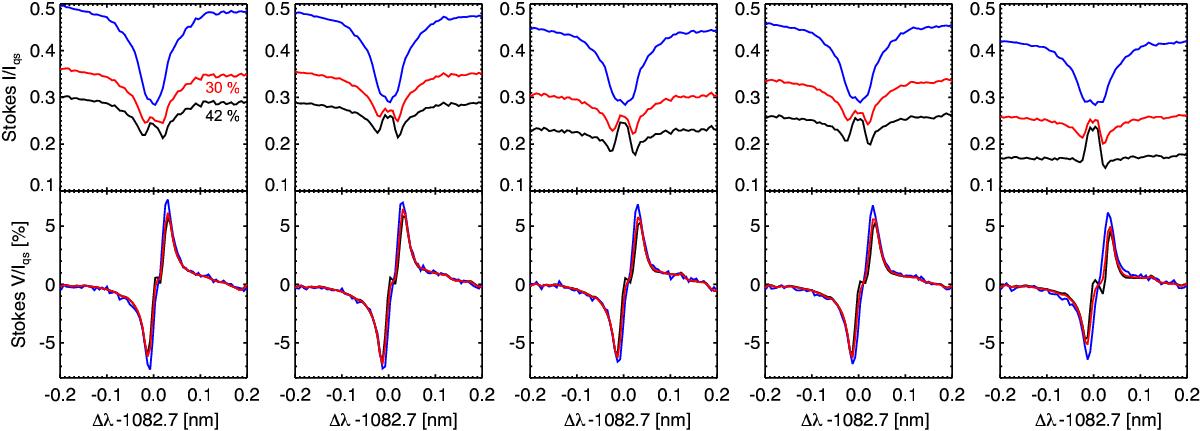
Variation of the original (blue) and reconstructed Stokes I/IQS and V/IQS profiles as we move from the inner penumbral boundary (first column) to the center of the umbra (last column). The Stokes I profiles in black correspond to the deconvolved profiles taking into account 42% of stray light while for the red profiles we only accounted for 30% of the stray light. For simplicity, we only represent five pixels. The location of the pixels can be found in the right panels of Fig. 2. The first profile corresponds to the lowest point.
Current usage metrics show cumulative count of Article Views (full-text article views including HTML views, PDF and ePub downloads, according to the available data) and Abstracts Views on Vision4Press platform.
Data correspond to usage on the plateform after 2015. The current usage metrics is available 48-96 hours after online publication and is updated daily on week days.
Initial download of the metrics may take a while.