Fig. B.1
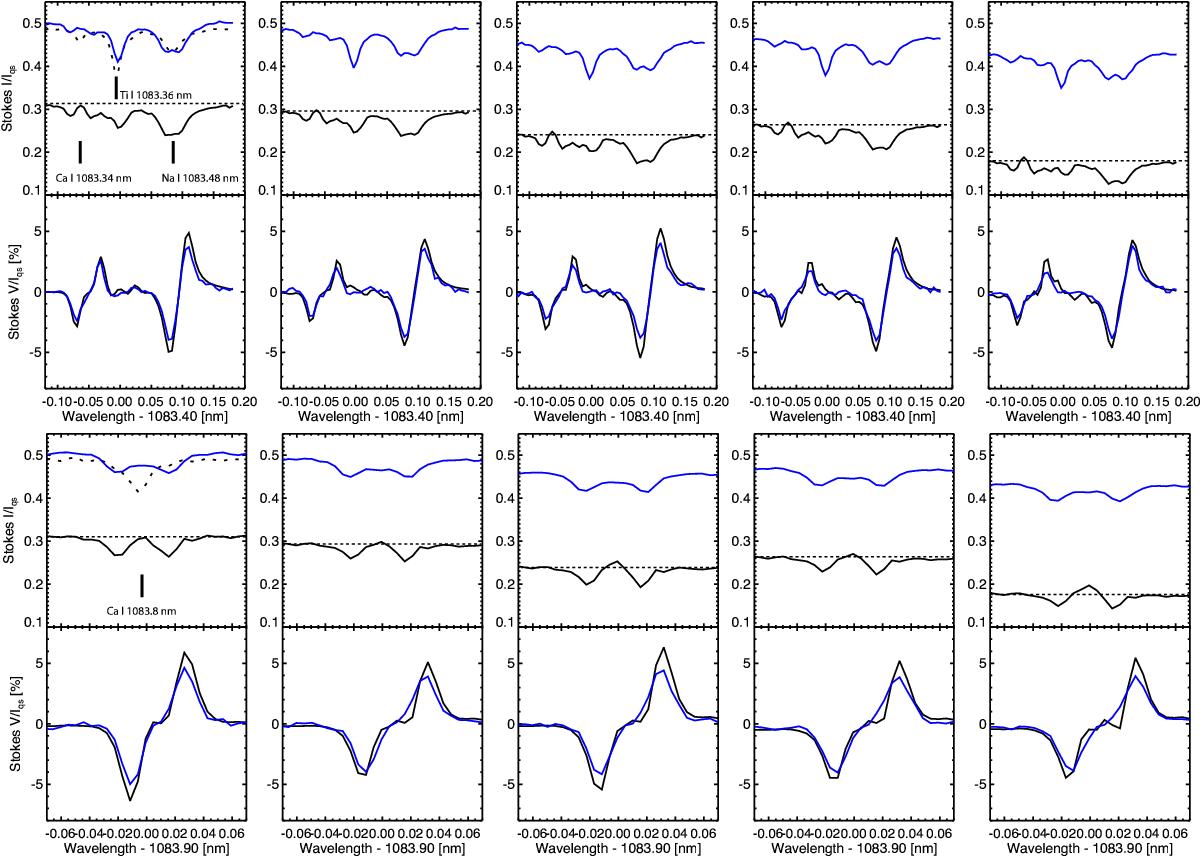
Variation of the original (blue color) and reconstructed (black color) Stokes I/IQS and V/IQS profiles corresponding to Ca I 1083.34 nm, Na I 1083.48 nm, and Ca I 1083.80 nm as we move from the inner penumbral boundary (first column) to the center of the umbra (last column). The pixels correspond to those shown in Fig. 3. The dotted profile in the first panel corresponds to a quiet Sun profile (multiplied by ×0.5 to fit within the Y-axis range). The horizontal dotted lines are drawn for reference.
Current usage metrics show cumulative count of Article Views (full-text article views including HTML views, PDF and ePub downloads, according to the available data) and Abstracts Views on Vision4Press platform.
Data correspond to usage on the plateform after 2015. The current usage metrics is available 48-96 hours after online publication and is updated daily on week days.
Initial download of the metrics may take a while.