Fig. 8
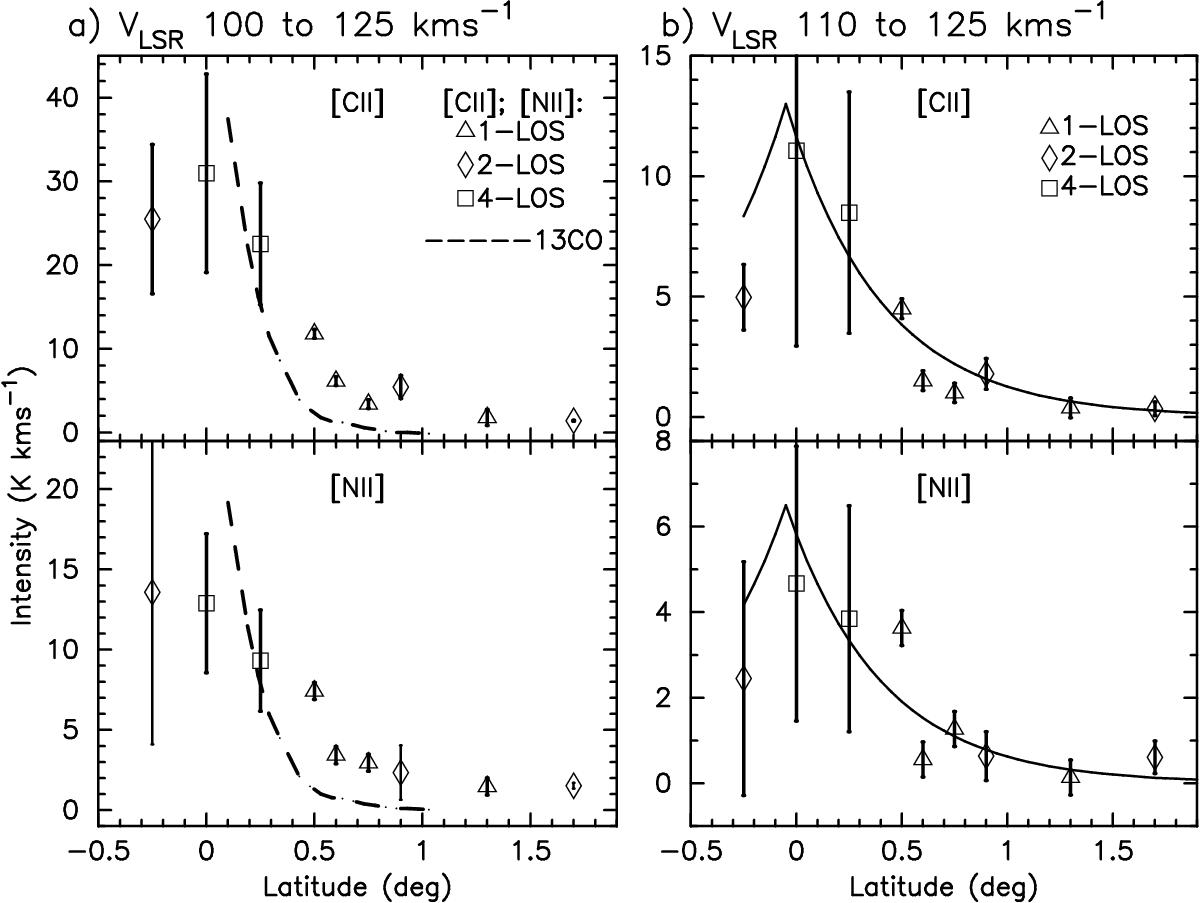
Left panels: integrated intensities of [C ii], [N ii], and 13CO (dashed line) over the velocity range 100 to 125 km s-1 versus latitude. The symbols indicate how many SOFIA LOS were averaged to calculate the emission intensity. The 13CO intensity profile is computed using the GRS data cube and we show only high latitude values to demonstrate how sharply it drops to nearly zero by b = 0.̊5. 13CO has a much smaller scale height than [C ii] and [N ii]. Right panels: integrated intensities of [C ii] and [N ii] over the velocity range 110 to 125 km s-1 versus latitude. There is no measurable 13CO in this velocity range, and the [C ii] and [N ii] arise solely from the WIM. The exponential curves correspond to exp(− (b−δb) /b0) with δb = −0.̊05 and b0 = 0.̊45.
Current usage metrics show cumulative count of Article Views (full-text article views including HTML views, PDF and ePub downloads, according to the available data) and Abstracts Views on Vision4Press platform.
Data correspond to usage on the plateform after 2015. The current usage metrics is available 48-96 hours after online publication and is updated daily on week days.
Initial download of the metrics may take a while.