Fig. 6
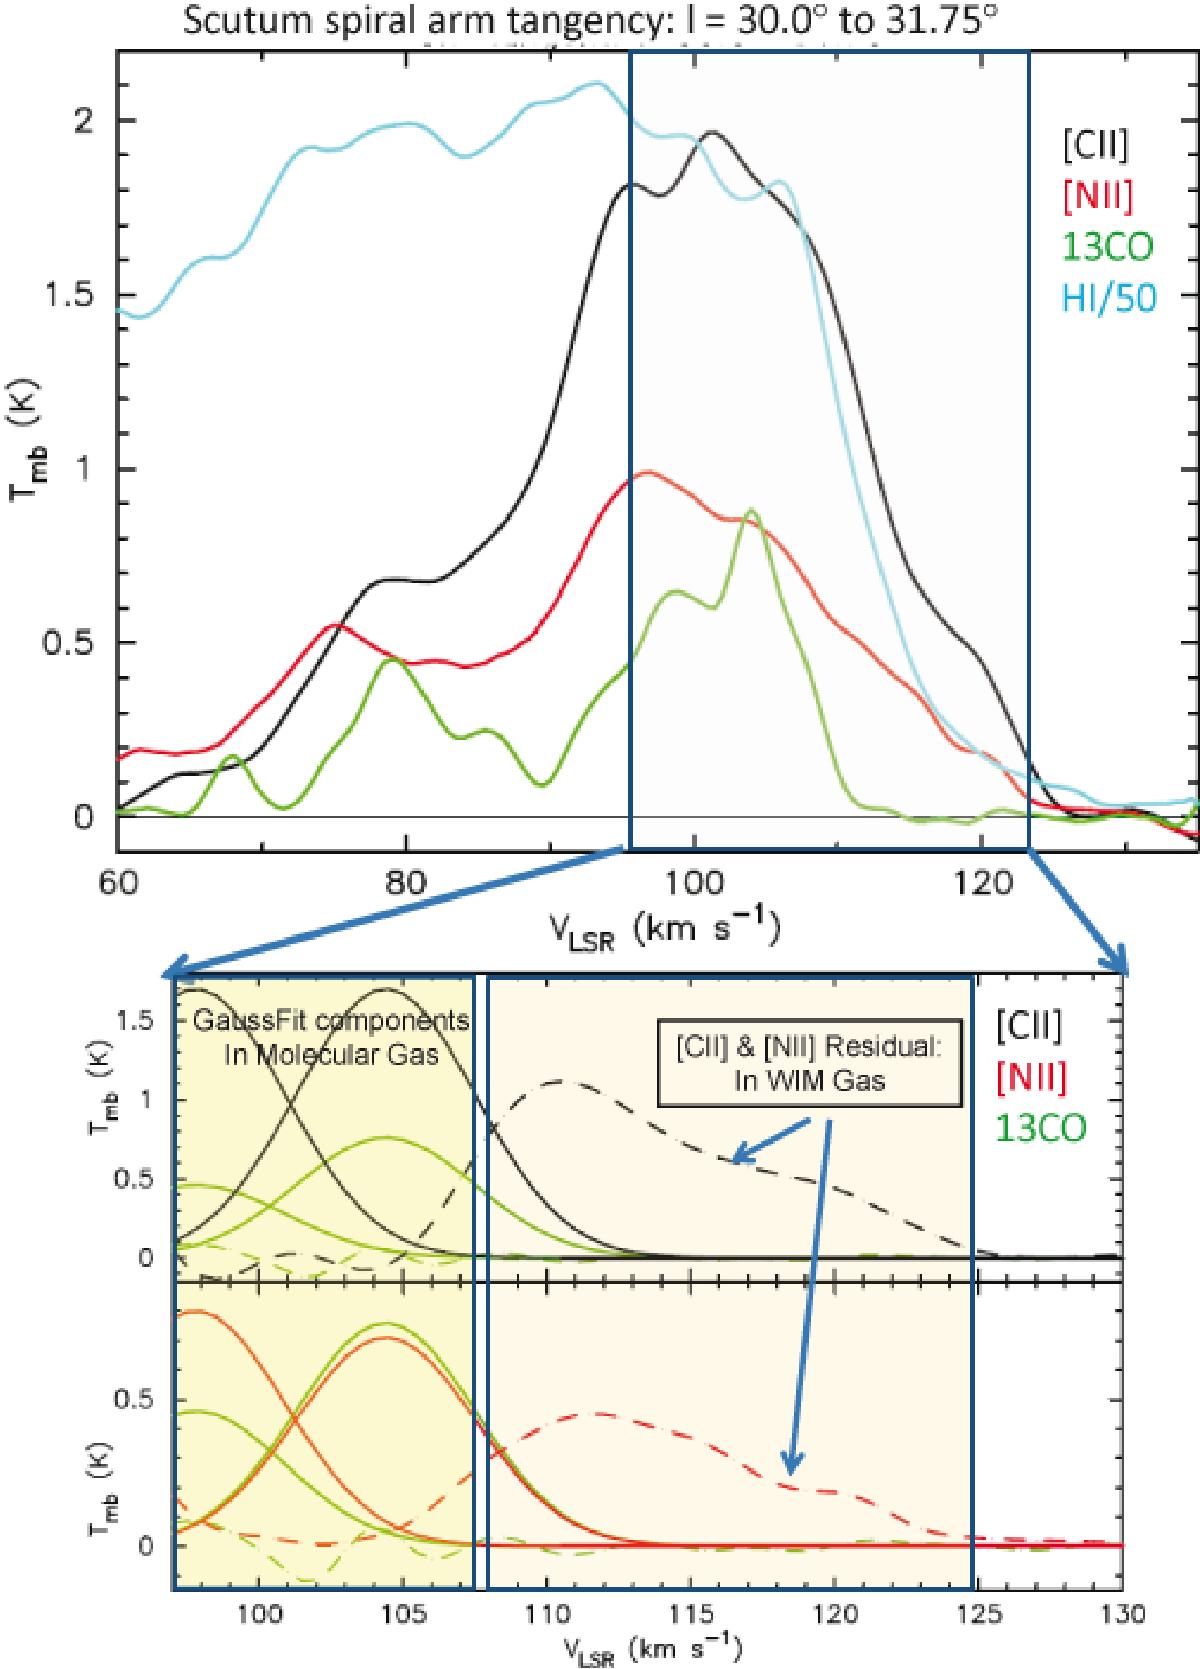
Top: spectra for the atomic, molecular, and ionic gas tracers, H i (blue), 13CO (green), [C ii] (black), and [N ii] (red), averaged over all LOS within b = ±0.̊25 plotted as main beam temperature, Tmb, versus VLSR. The ionized gas tracers are seen to extend to much higher velocities, corresponding to the innermost leading edge of the Scutum arm, than the molecular gas as traced by 13CO. Bottom: expanded view of the ionized gas emission after subtracting out the [C ii] and [N ii] emission arising from the molecular clouds traced by 13CO. The solid green curves represent two of the Gaussian components fit to the 13CO emission. The dashed green curve is the residual 13CO after subtraction. Gaussian profiles were used to fit the [C ii] and [N ii] emission associated with the gas at velocities <110 km s-1, while keeping their VLSR at the peak and FWHM the same as the 13CO, and only adjusting their peak intensities. Thus what remains for VLSR ≥ 110 km s-1 is the [C ii] and [N ii] excess arising solely from the highly ionized gas with no associated CO.
Current usage metrics show cumulative count of Article Views (full-text article views including HTML views, PDF and ePub downloads, according to the available data) and Abstracts Views on Vision4Press platform.
Data correspond to usage on the plateform after 2015. The current usage metrics is available 48-96 hours after online publication and is updated daily on week days.
Initial download of the metrics may take a while.