Fig. 5
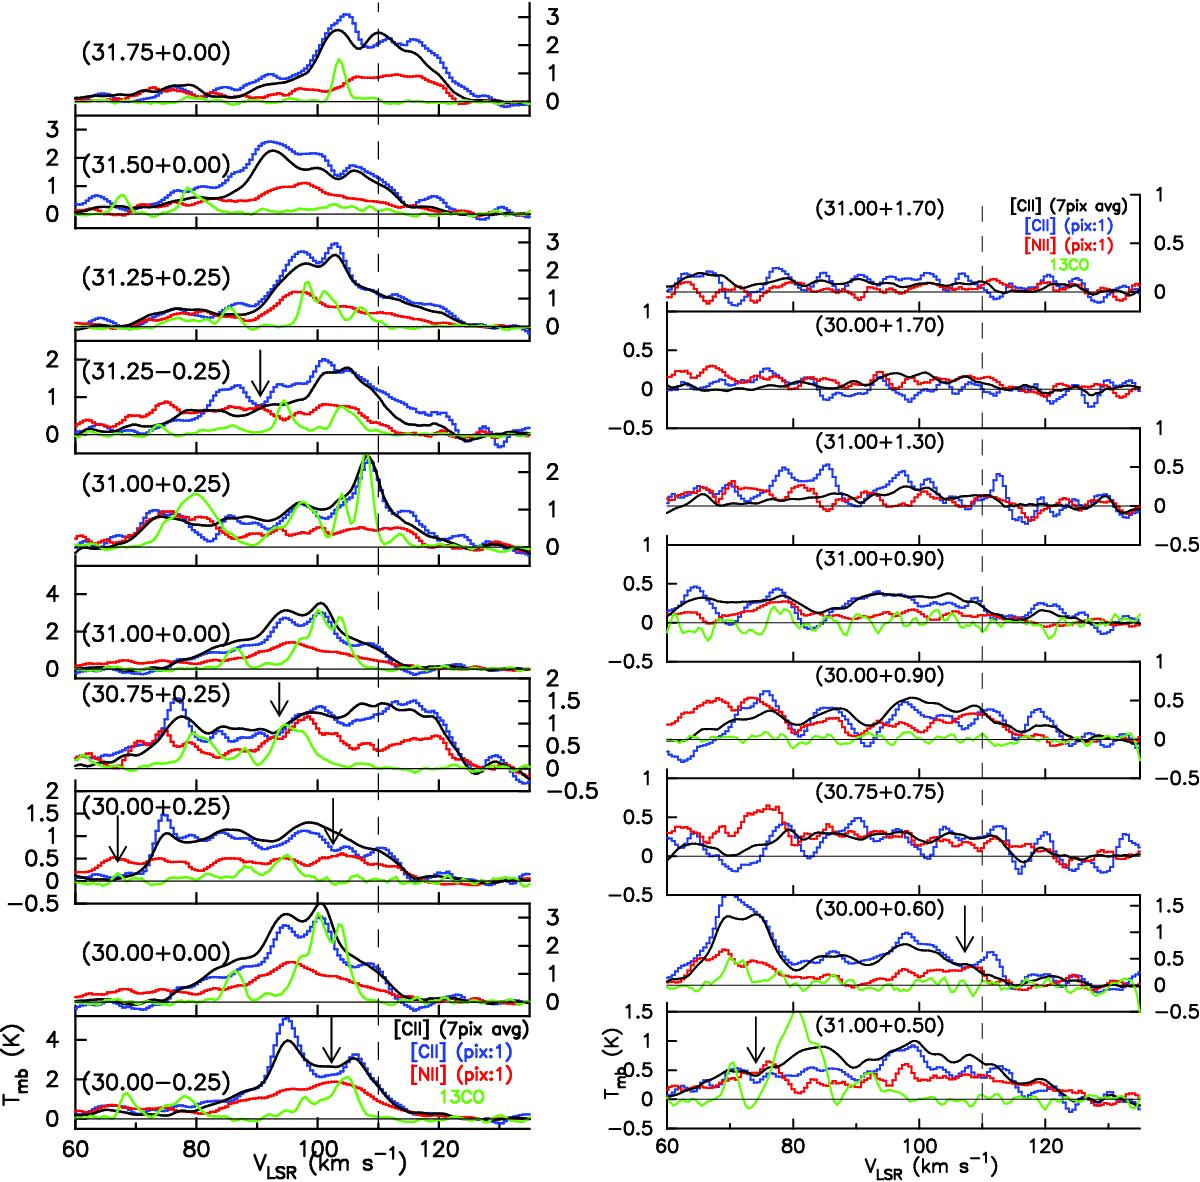
Left: emission spectra of [C ii] (blue and black), [N ii] (red), and 13CO (green) for the ten lines of sight that are within b = ±0.̊25 are plotted as Tmb versus velocity. The central [C ii] pixel is plotted in blue and the average of the seven [C ii] pixels is plotted in black. The single and average [C ii] emission profiles are similar but not exactly identical owing to variations in emission across the footprint of the upGREAT array. The black vertical dashed line marks the tangent velocity of the Scutum spiral arm. Right: same as in the left panel for the eight lines of sight with b> 0.̊25. The downward black arrows mark a few of the clearly evident [C ii] absorption features.
Current usage metrics show cumulative count of Article Views (full-text article views including HTML views, PDF and ePub downloads, according to the available data) and Abstracts Views on Vision4Press platform.
Data correspond to usage on the plateform after 2015. The current usage metrics is available 48-96 hours after online publication and is updated daily on week days.
Initial download of the metrics may take a while.