Fig. 4
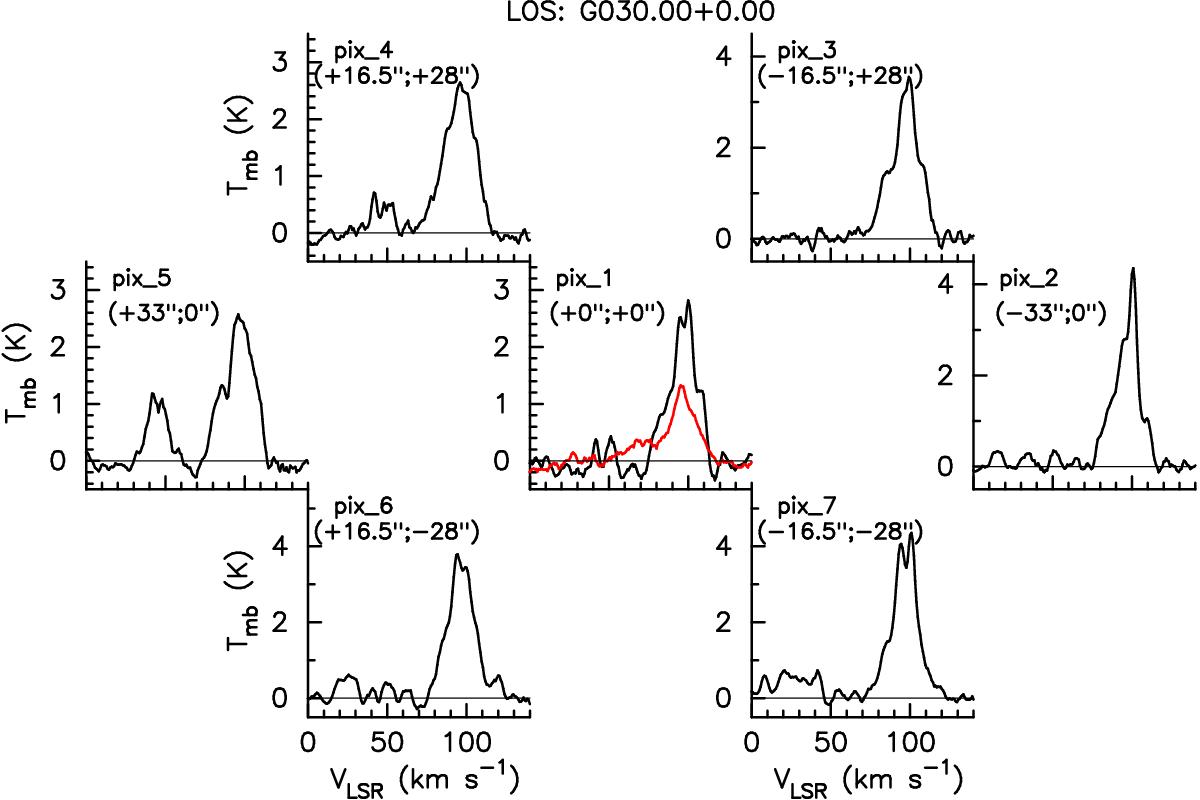
The seven [C ii] spectra observed by upGREAT (black) and the central [N ii] spectrum (red) observed by GREAT towards (l, b) = (30.̊0, 0.̊0). While the overall shapes of the [C ii] lines across the Scutum spiral arm (Vlsr = 60 to 130 km s-1) within each pixel are similar, the small differences among them demonstrate that there is structure due to individual cloud components. The [N ii] emission in the central pixel is detected across the entire velocity range of [C ii] in the Scutum arm.
Current usage metrics show cumulative count of Article Views (full-text article views including HTML views, PDF and ePub downloads, according to the available data) and Abstracts Views on Vision4Press platform.
Data correspond to usage on the plateform after 2015. The current usage metrics is available 48-96 hours after online publication and is updated daily on week days.
Initial download of the metrics may take a while.