Fig. 1
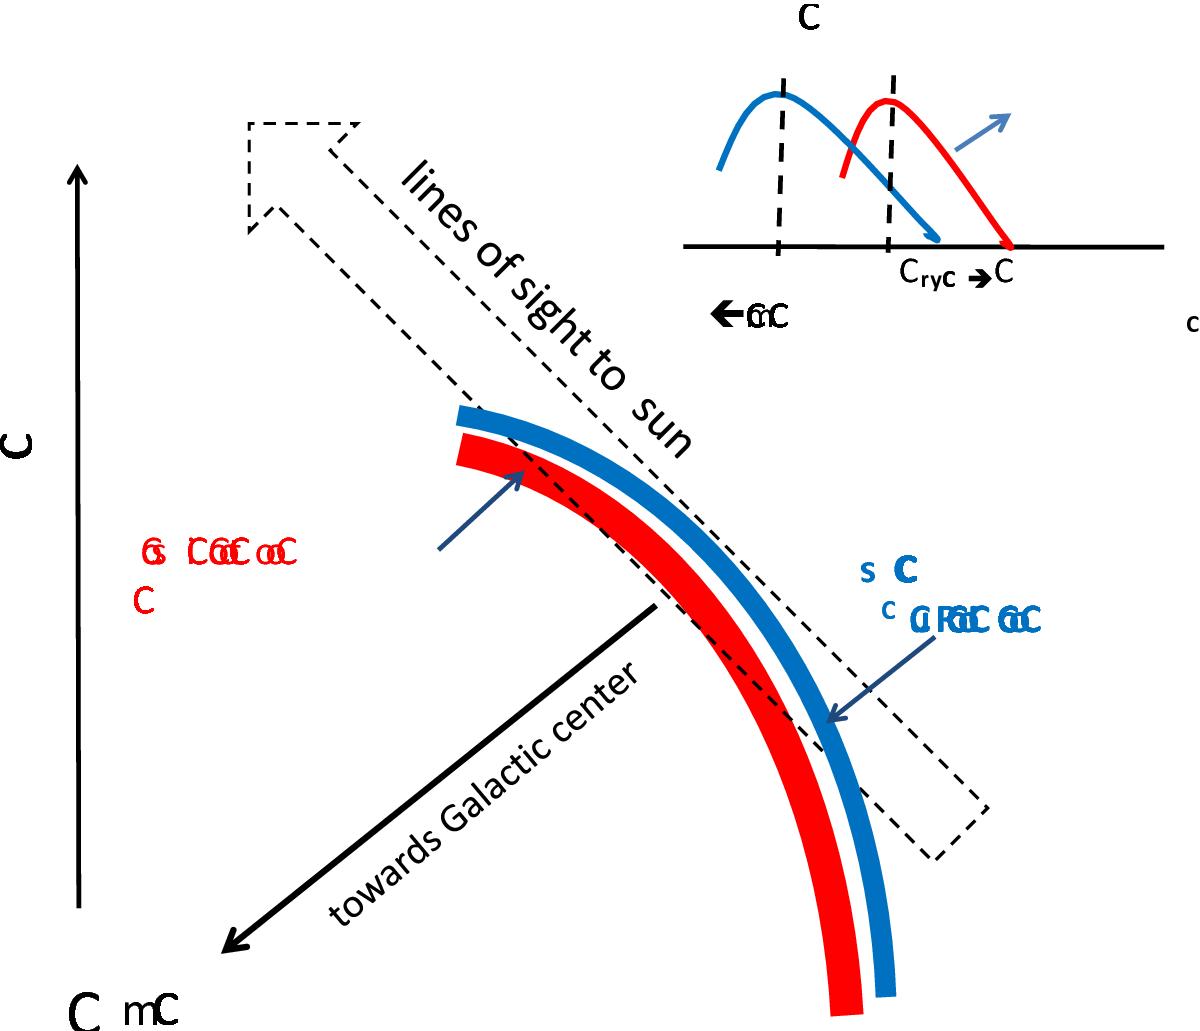
Schematic view of the Scutum spiral arm tangency showing the structure of the gas layers (adapted from Fig. 6 in Velusamy et al. 2015). The emission of key gas tracers along the tangency, [C ii], [N ii], and CO help distinguish the WIM and molecular gas layers indicated as red and blue colors, respectively. Note the long path length along the tangency which improves the sensitivity to the weak [C ii] and [N ii] emission from the WIM. A schematic of the velocity (VLSR) profile (shown in the inset) of the corresponding spectral line intensities for each layer, demonstrates why it is possible to separate the emission from the WIM from the neutral gas components. Note that this cartoon is intended to be a schematic and is not to scale.
Current usage metrics show cumulative count of Article Views (full-text article views including HTML views, PDF and ePub downloads, according to the available data) and Abstracts Views on Vision4Press platform.
Data correspond to usage on the plateform after 2015. The current usage metrics is available 48-96 hours after online publication and is updated daily on week days.
Initial download of the metrics may take a while.