Free Access
Fig. 6
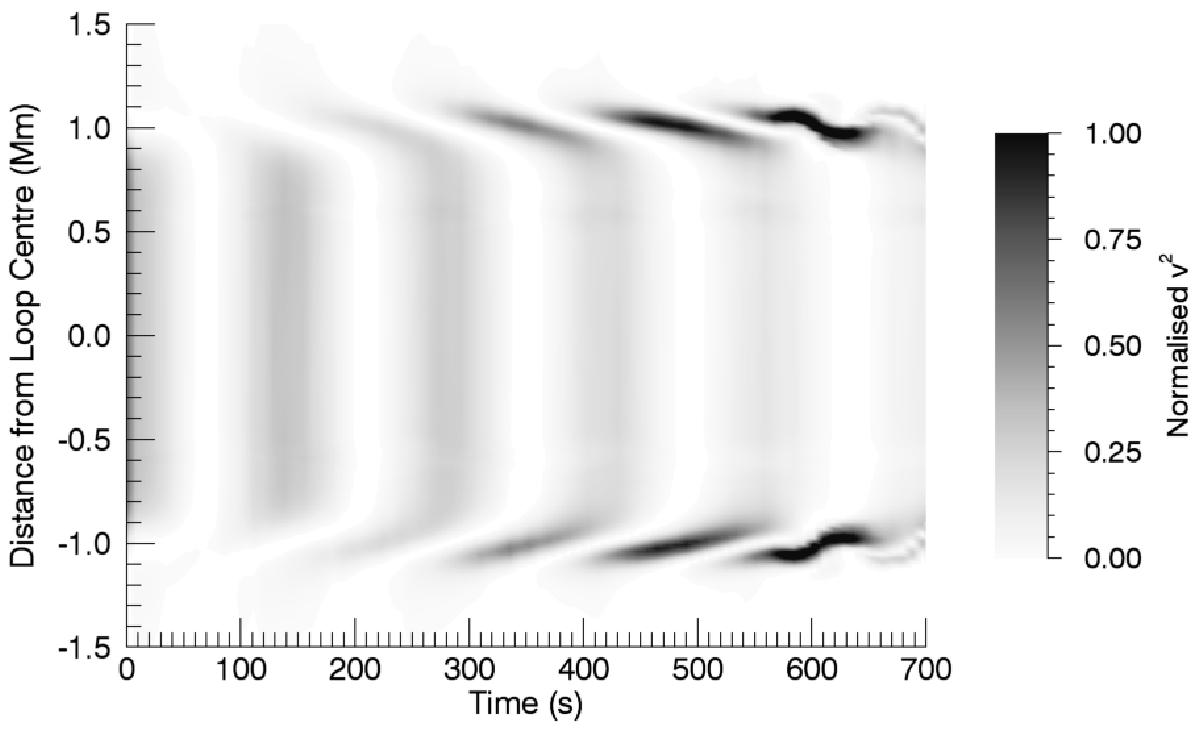
Evolution of the square of the velocity along the line y = 0 (through the loop apex), z = 0. Here v2 is normalised to the maximum value obtained during the simulation. The figure is produced from Case 2b, a twisted field simulation.
Current usage metrics show cumulative count of Article Views (full-text article views including HTML views, PDF and ePub downloads, according to the available data) and Abstracts Views on Vision4Press platform.
Data correspond to usage on the plateform after 2015. The current usage metrics is available 48-96 hours after online publication and is updated daily on week days.
Initial download of the metrics may take a while.