Fig. 18
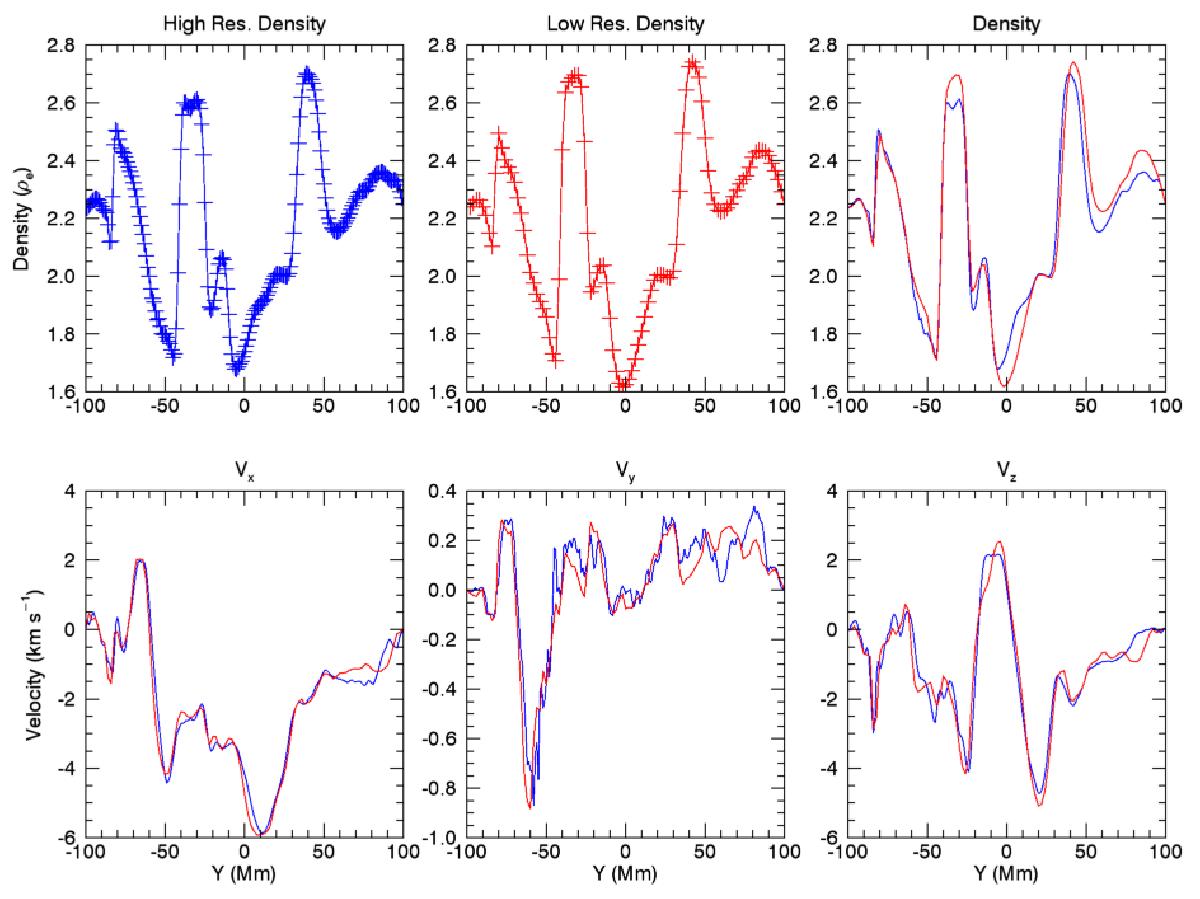
Top row: density profile along the most under-resolved vertical line at t = 900 s for the high resolution (blue) and low resolution (red) simulations. In the first two panels, the position of grid points are denoted with a cross, and the third panel shows a comparison between the two simulations. Bottom row: comparison of the three velocity components along the same line for the two different resolutions.
Current usage metrics show cumulative count of Article Views (full-text article views including HTML views, PDF and ePub downloads, according to the available data) and Abstracts Views on Vision4Press platform.
Data correspond to usage on the plateform after 2015. The current usage metrics is available 48-96 hours after online publication and is updated daily on week days.
Initial download of the metrics may take a while.