Free Access
Fig. 17
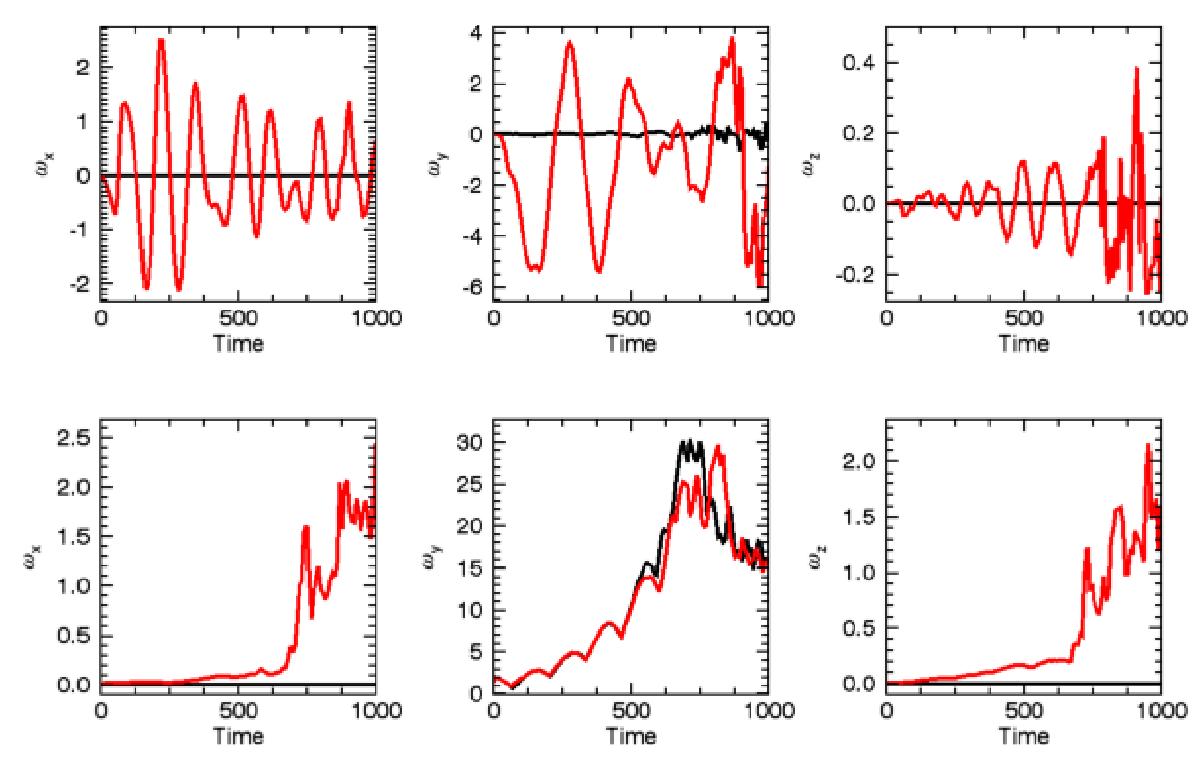
Top row: the three components of the vorticity integrated over the horizontal plane at the loop apex. Bottom row: maximum size of each component of the vorticity in this plane. For both of the rows, the black line corresponds to the straight field simulation (Case 1) and the red line corresponds to Case 2c.
Current usage metrics show cumulative count of Article Views (full-text article views including HTML views, PDF and ePub downloads, according to the available data) and Abstracts Views on Vision4Press platform.
Data correspond to usage on the plateform after 2015. The current usage metrics is available 48-96 hours after online publication and is updated daily on week days.
Initial download of the metrics may take a while.