Fig. 16
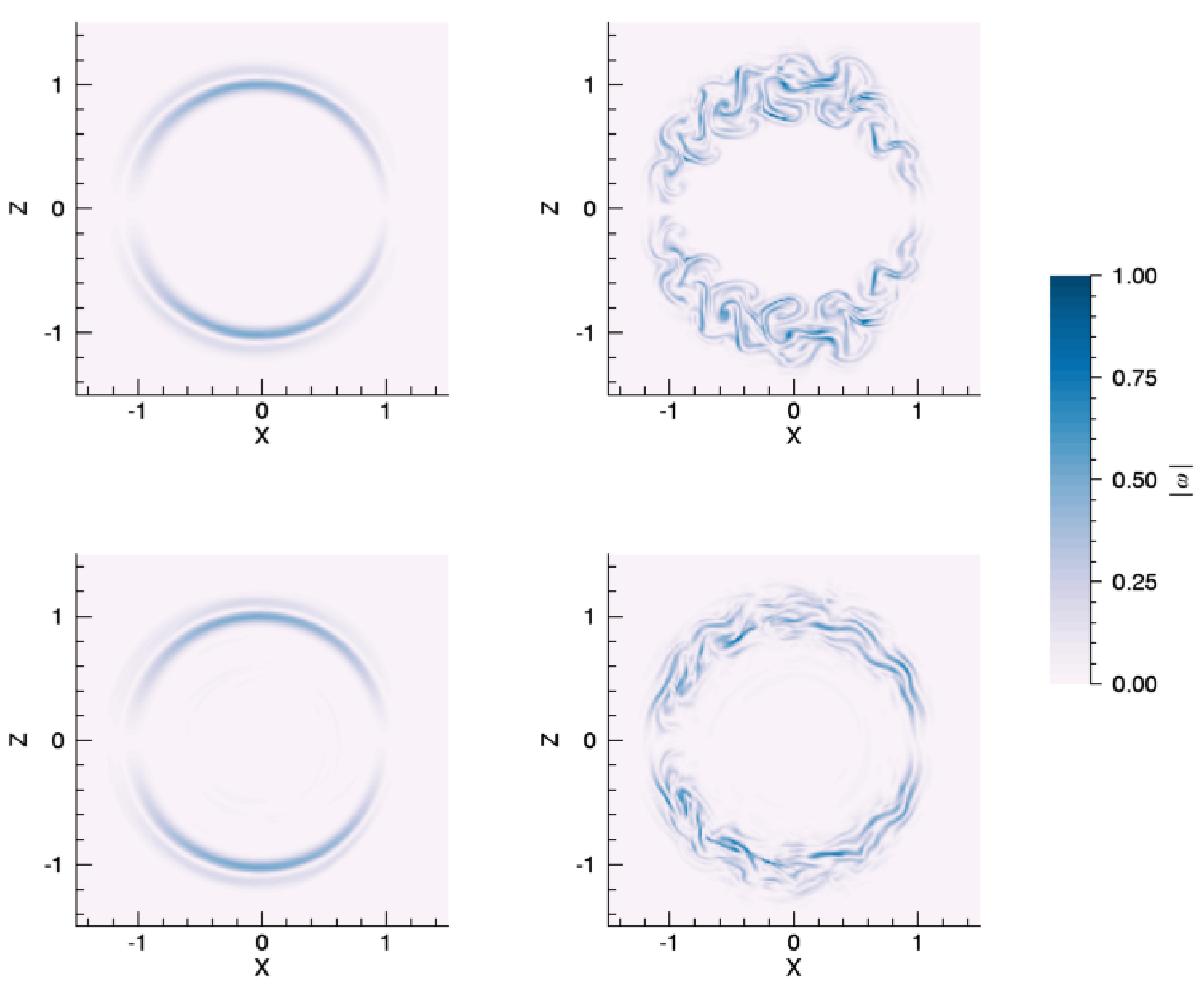
Magnitude of the vorticity at two different times, t = 420 (left) and t = 990 s (right) in the horizontal cross-section through the loop apex. The top row corresponds to Case 1, the straight field simulation, and the second row corresponds to Case 2c. Here we have normalised the vorticity to the maximum observed in either simulation.
Current usage metrics show cumulative count of Article Views (full-text article views including HTML views, PDF and ePub downloads, according to the available data) and Abstracts Views on Vision4Press platform.
Data correspond to usage on the plateform after 2015. The current usage metrics is available 48-96 hours after online publication and is updated daily on week days.
Initial download of the metrics may take a while.