Free Access
Fig. 14
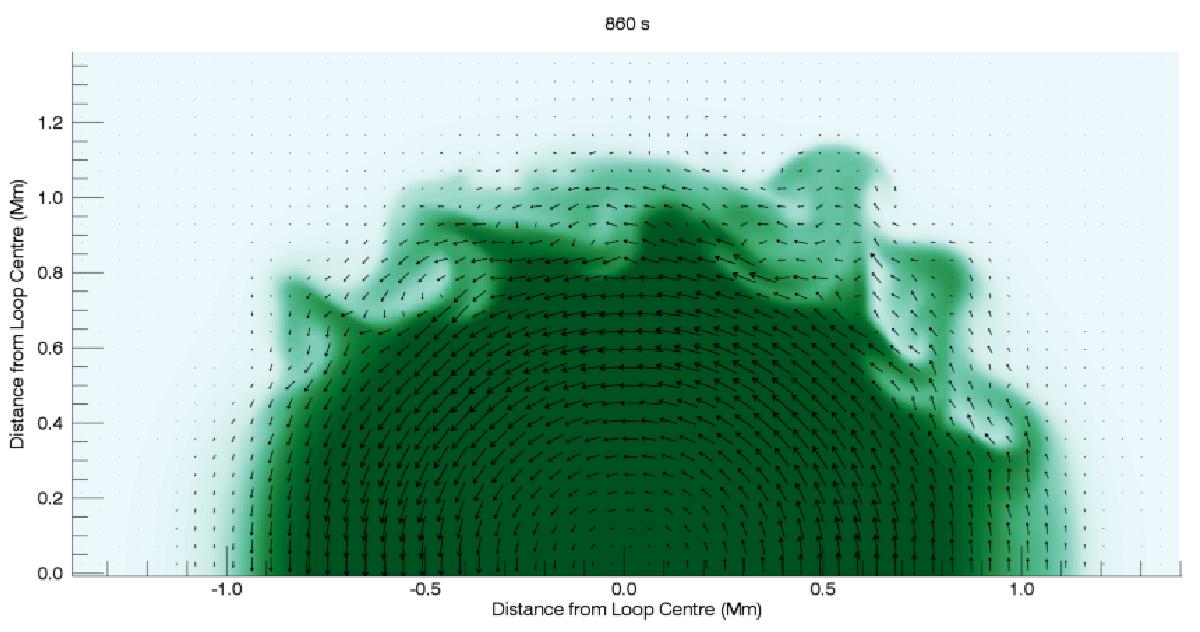
Horizontal components of the magnetic field (vectors) and the deformed density profile (coloured contour plot) at the loop apex once the KHI is well-developed. The result shown is produced from Case 2b, a twisted field simulation.
Current usage metrics show cumulative count of Article Views (full-text article views including HTML views, PDF and ePub downloads, according to the available data) and Abstracts Views on Vision4Press platform.
Data correspond to usage on the plateform after 2015. The current usage metrics is available 48-96 hours after online publication and is updated daily on week days.
Initial download of the metrics may take a while.