Fig. 13
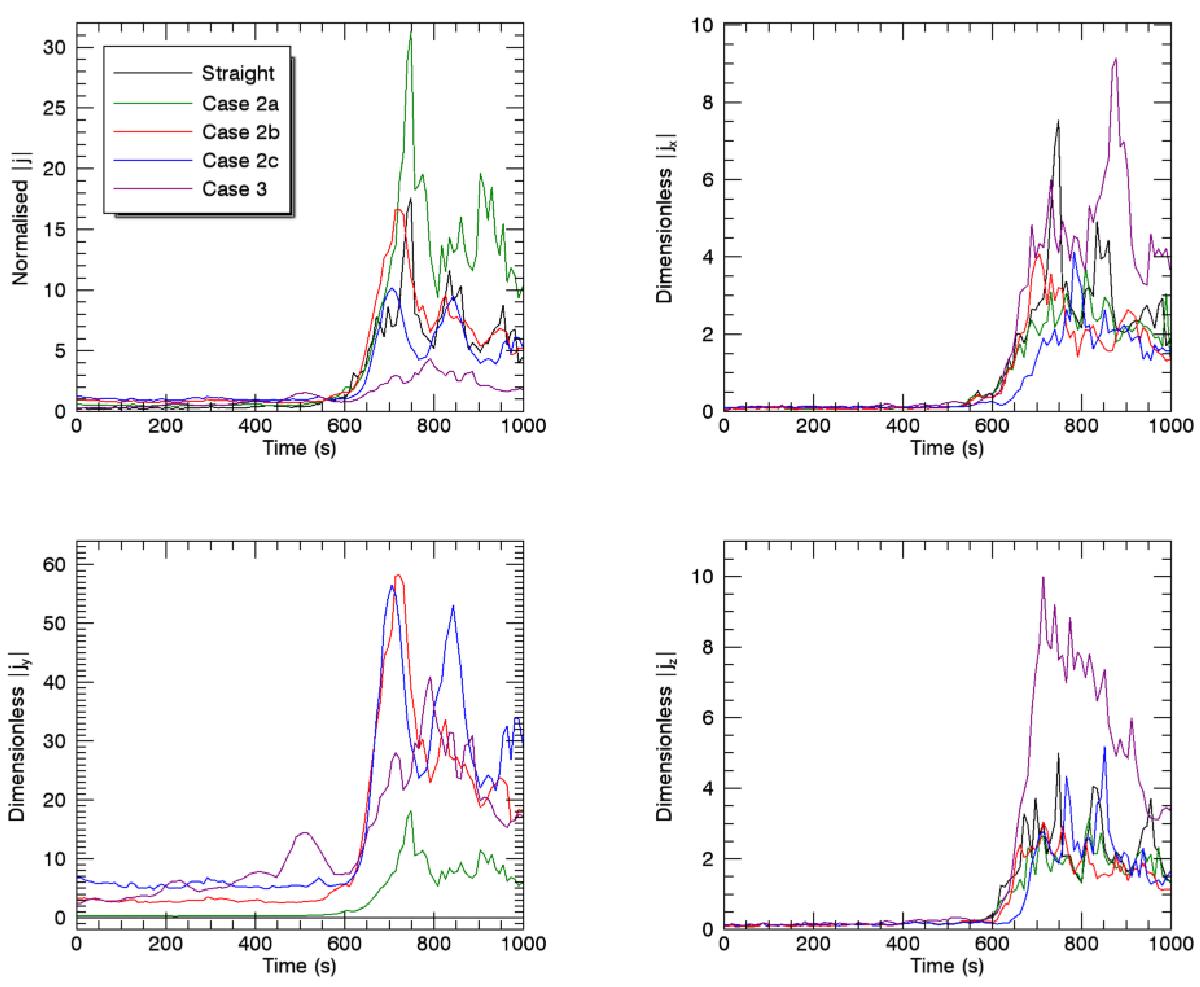
Formation of large currents during the onset of the KHI. The top-left panel displays the maximum magnitude of the current in the horizontal cross-section at the loop apex. For each simulation, it is normalised to the maximum current in this plane at t = 560 s, immediately prior to the onset of the KHI, to show the relative growth of the currents during the development of the instability. The other three panels display the maximum magnitude of each component in the same cross-section. The units are dimensionless but are the same for each of the components.
Current usage metrics show cumulative count of Article Views (full-text article views including HTML views, PDF and ePub downloads, according to the available data) and Abstracts Views on Vision4Press platform.
Data correspond to usage on the plateform after 2015. The current usage metrics is available 48-96 hours after online publication and is updated daily on week days.
Initial download of the metrics may take a while.