Fig. 13
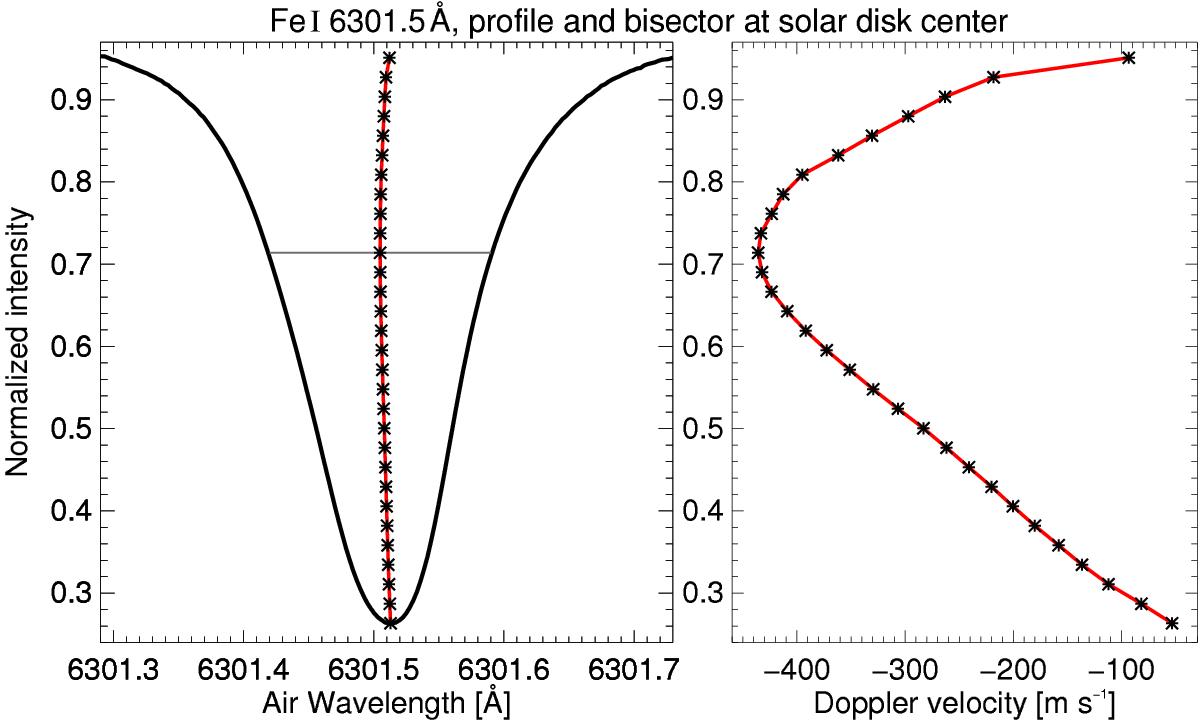
Spectral line profile and bisectors of Fe i 6301.5 Å observed in the Quiet Sun at disk center. The line profile is drawn as a black solid line in the left panel, with intensities normalized to the spectral continuum and air wavelength in Å. An exemplary bisector is indicated as a gray horizontal line. All center positions of the bisectors are shown as black asterisks, their interpolation is displayed as a red solid line. In the right panel, the wavelengths were translated into Doppler velocities in m s-1.
Current usage metrics show cumulative count of Article Views (full-text article views including HTML views, PDF and ePub downloads, according to the available data) and Abstracts Views on Vision4Press platform.
Data correspond to usage on the plateform after 2015. The current usage metrics is available 48-96 hours after online publication and is updated daily on week days.
Initial download of the metrics may take a while.