Fig. 12
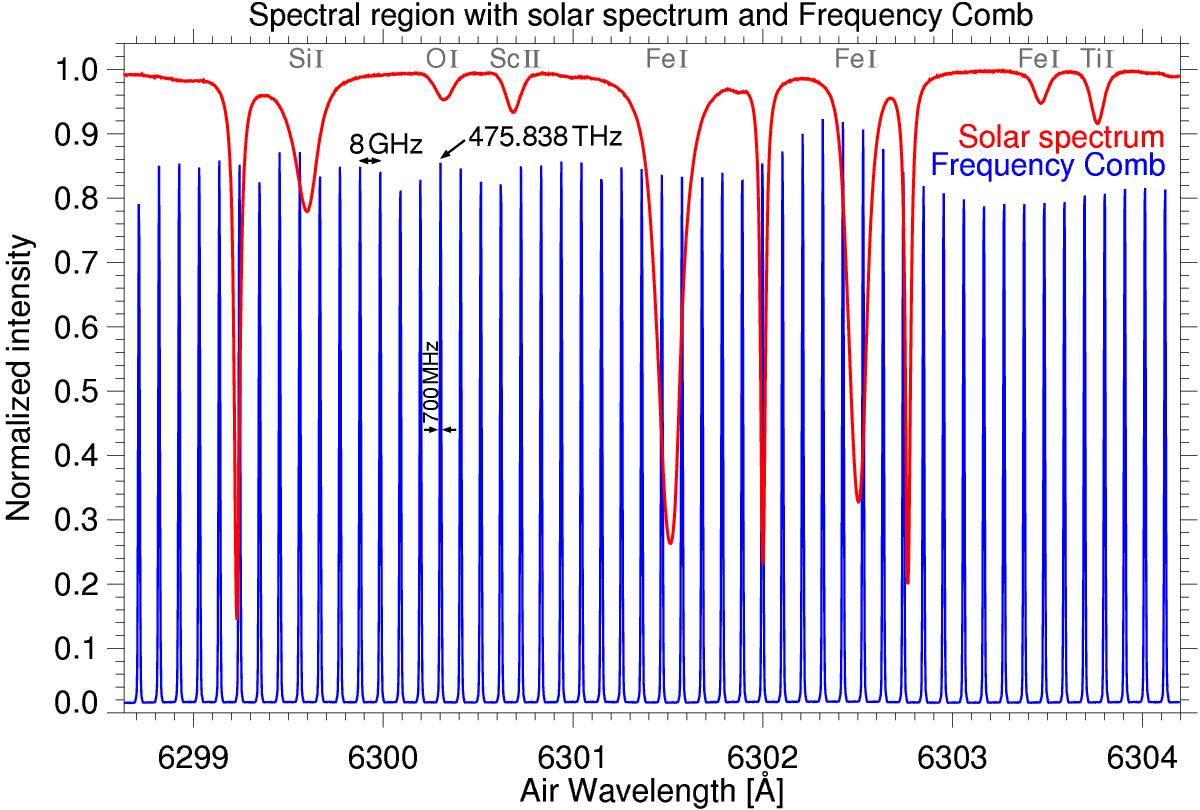
Spectral region with a typical cycle of solar spectrum and frequency comb signal. The spectrograph camera records a spectral region with a wavelength width of 5.6 Å, here centered around 6301.5 Å. The solar spectrum in red was normalized to the continuum intensity and consists of several photospheric lines (elements in gray). The three unnamed narrow lines are telluric O2 lines. The frequency comb spectrum is overlaid in blue and consists of 52 equally spaced (8 GHz) emission modes with a full width at half maximum of 700 MHz. One frequency mode (here 475.838 THz) has to be unambiguously identified through its proximity to a spectral line core. The solar and the comb lines are indeed observed sequentially to avoid any deterioration of the solar line profile through the superposition of the comb lines.
Current usage metrics show cumulative count of Article Views (full-text article views including HTML views, PDF and ePub downloads, according to the available data) and Abstracts Views on Vision4Press platform.
Data correspond to usage on the plateform after 2015. The current usage metrics is available 48-96 hours after online publication and is updated daily on week days.
Initial download of the metrics may take a while.