Fig. 11
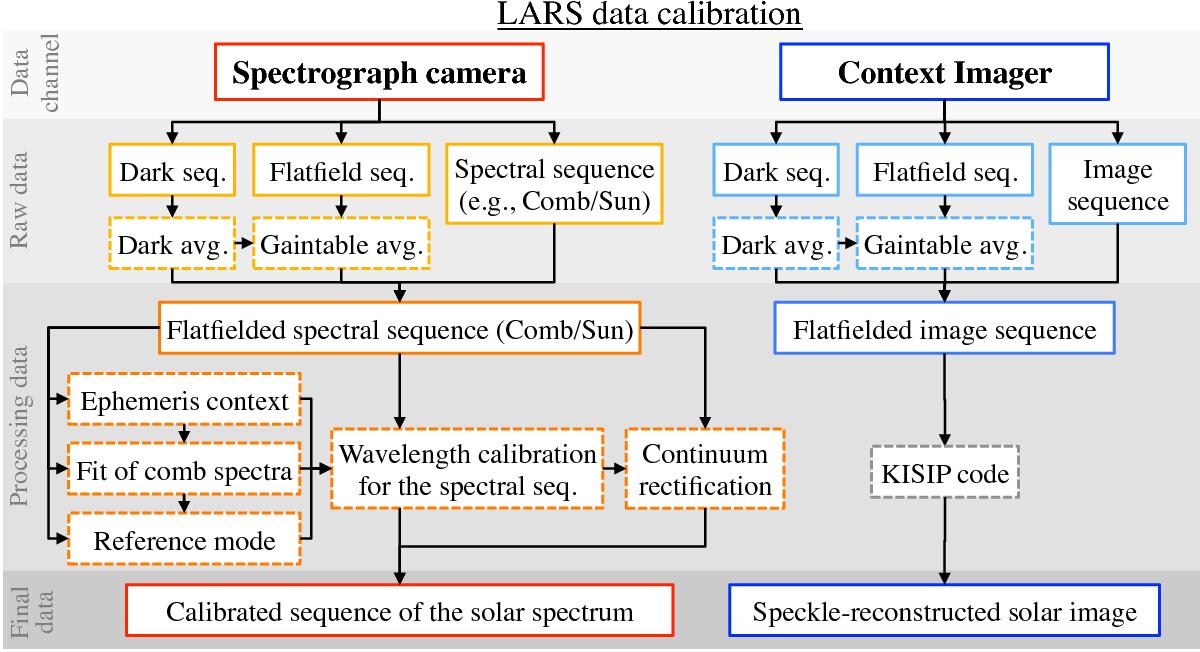
Calibration scheme for LARS data. The data reduction from the raw to the final state is displayed for both LARS channels – the spectrograph camera (red colors) and the Context Imager (blue colors). Black arrows indicate the direction of processing. Raw, processing, and final state products are drawn with solid borders around the text box. Intermediate calibration steps and tools are indicated by dashed borders.
Current usage metrics show cumulative count of Article Views (full-text article views including HTML views, PDF and ePub downloads, according to the available data) and Abstracts Views on Vision4Press platform.
Data correspond to usage on the plateform after 2015. The current usage metrics is available 48-96 hours after online publication and is updated daily on week days.
Initial download of the metrics may take a while.