Fig. 18
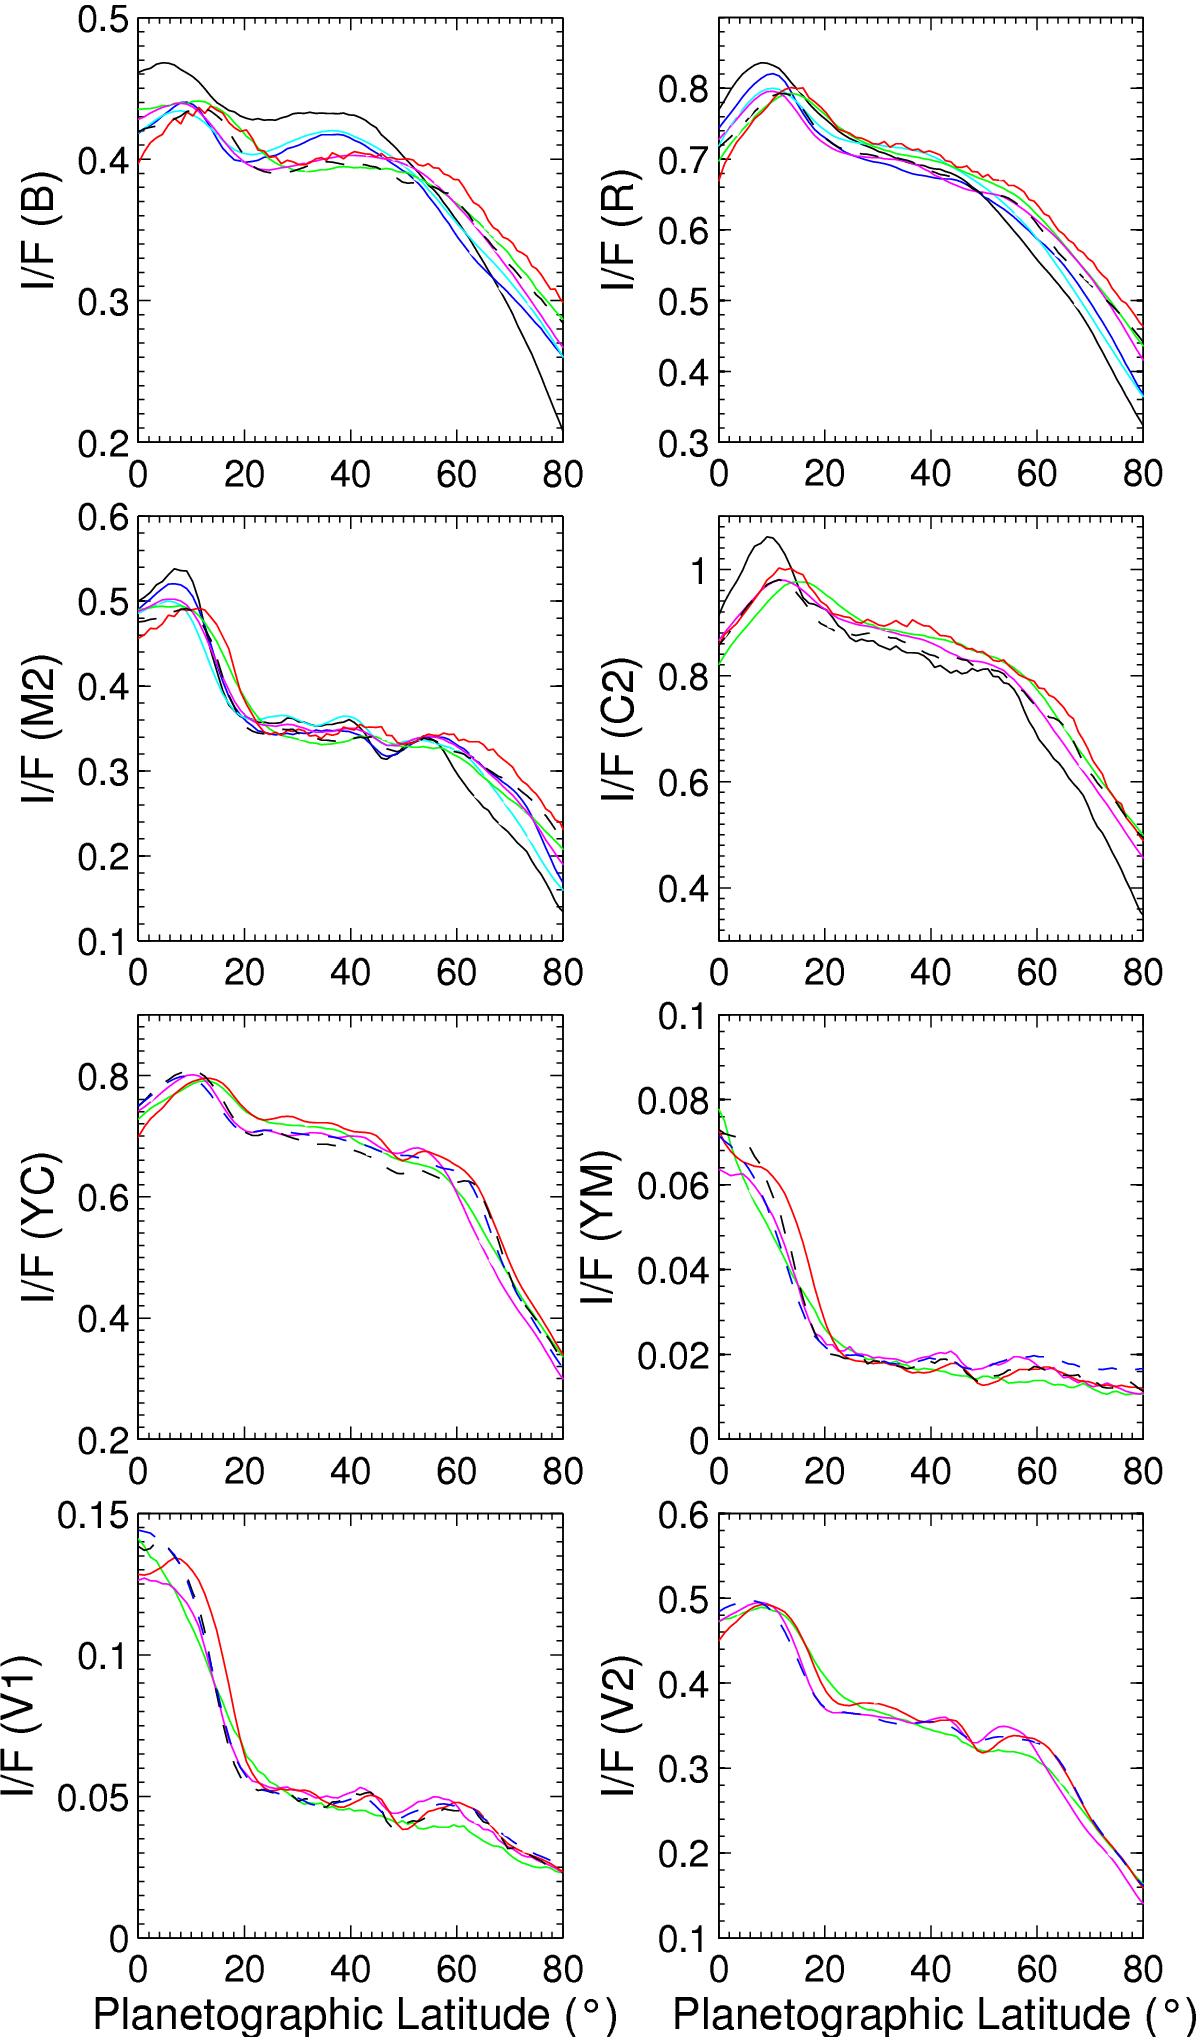
Temporal absolute reflectivity north-south scans of the northern hemisphere of Saturn at selected wavelengths for the period from April 2013 to May 2016. The black line corresponds to April 2013, blue to April 2014, cyan to July 2014, green to May 2015, magenta to July 2015, red to March 2016, and the black dashed line to May 2016 and blue dashed to July 2016.
Current usage metrics show cumulative count of Article Views (full-text article views including HTML views, PDF and ePub downloads, according to the available data) and Abstracts Views on Vision4Press platform.
Data correspond to usage on the plateform after 2015. The current usage metrics is available 48-96 hours after online publication and is updated daily on week days.
Initial download of the metrics may take a while.