Fig. A.1
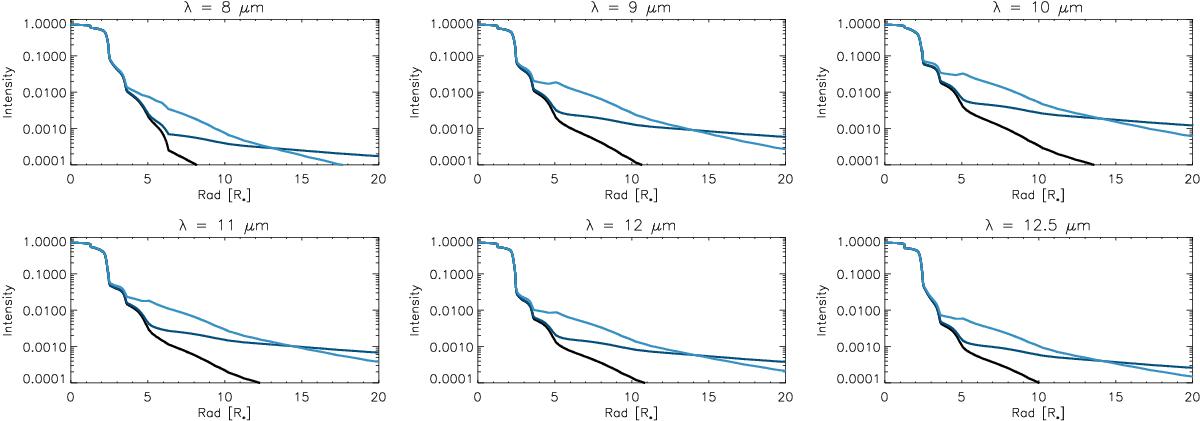
Spatial intensity profile for the models shown in Fig. 5 (minimum luminosity phase). Each panel corresponds to a wavelength in the N-band interval [8–13 μm]. The dark blue curve is from a snapshot with core-mantel grains of 5% thickness. The light blue curve show the results from fitting the core-mantel spectra with snapshots of the atmosphere where we set the lower limit for the grain temperature to 450 K.
Current usage metrics show cumulative count of Article Views (full-text article views including HTML views, PDF and ePub downloads, according to the available data) and Abstracts Views on Vision4Press platform.
Data correspond to usage on the plateform after 2015. The current usage metrics is available 48-96 hours after online publication and is updated daily on week days.
Initial download of the metrics may take a while.