Fig. 4
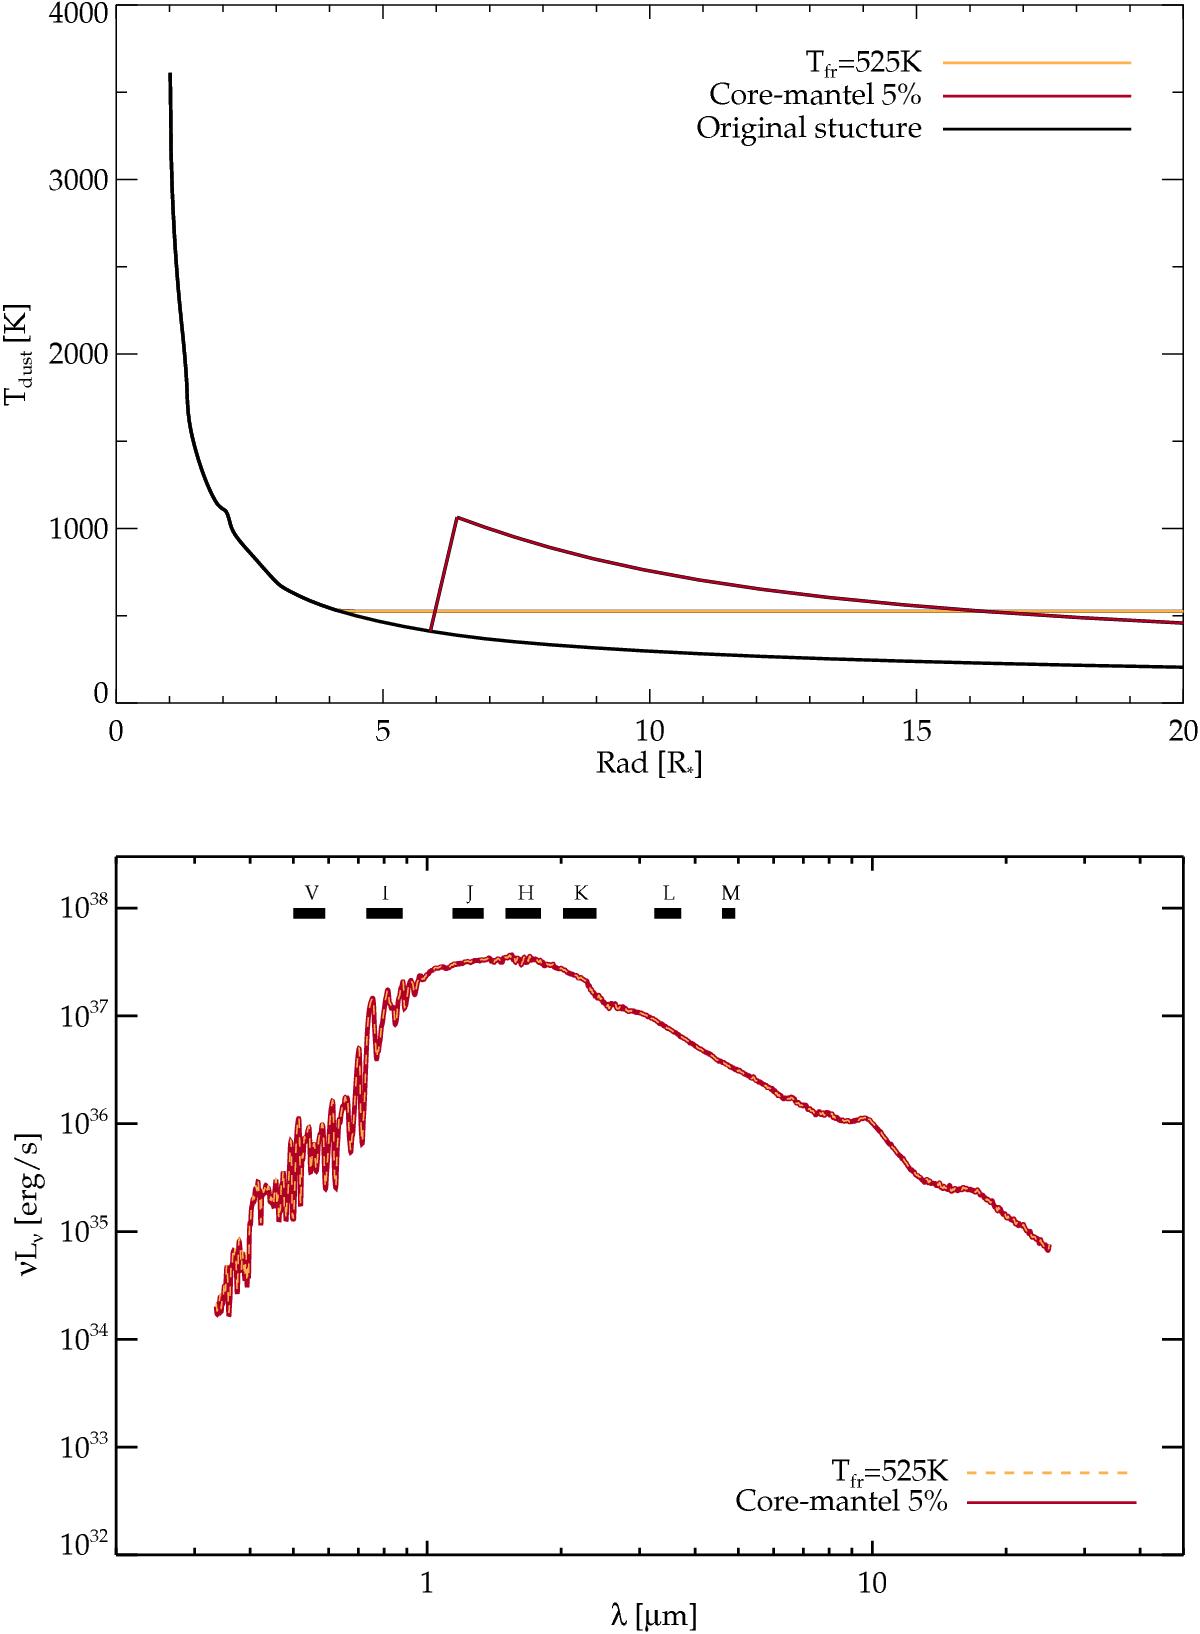
Top panel: grain temperature as a function of distance from the star. Lower panel: spectral energy distributions as a function of wavelength. Structure from model A3 during the maximum luminosity phase. The dark red curves show temperature and spectra from snapshots with core-mantel grains of 5% thickness. The light red curves show the results from fitting the core-mantel spectra with snapshots of the atmosphere where we set the lower limit for the grain temperature to 525 K.
Current usage metrics show cumulative count of Article Views (full-text article views including HTML views, PDF and ePub downloads, according to the available data) and Abstracts Views on Vision4Press platform.
Data correspond to usage on the plateform after 2015. The current usage metrics is available 48-96 hours after online publication and is updated daily on week days.
Initial download of the metrics may take a while.