Fig. 1
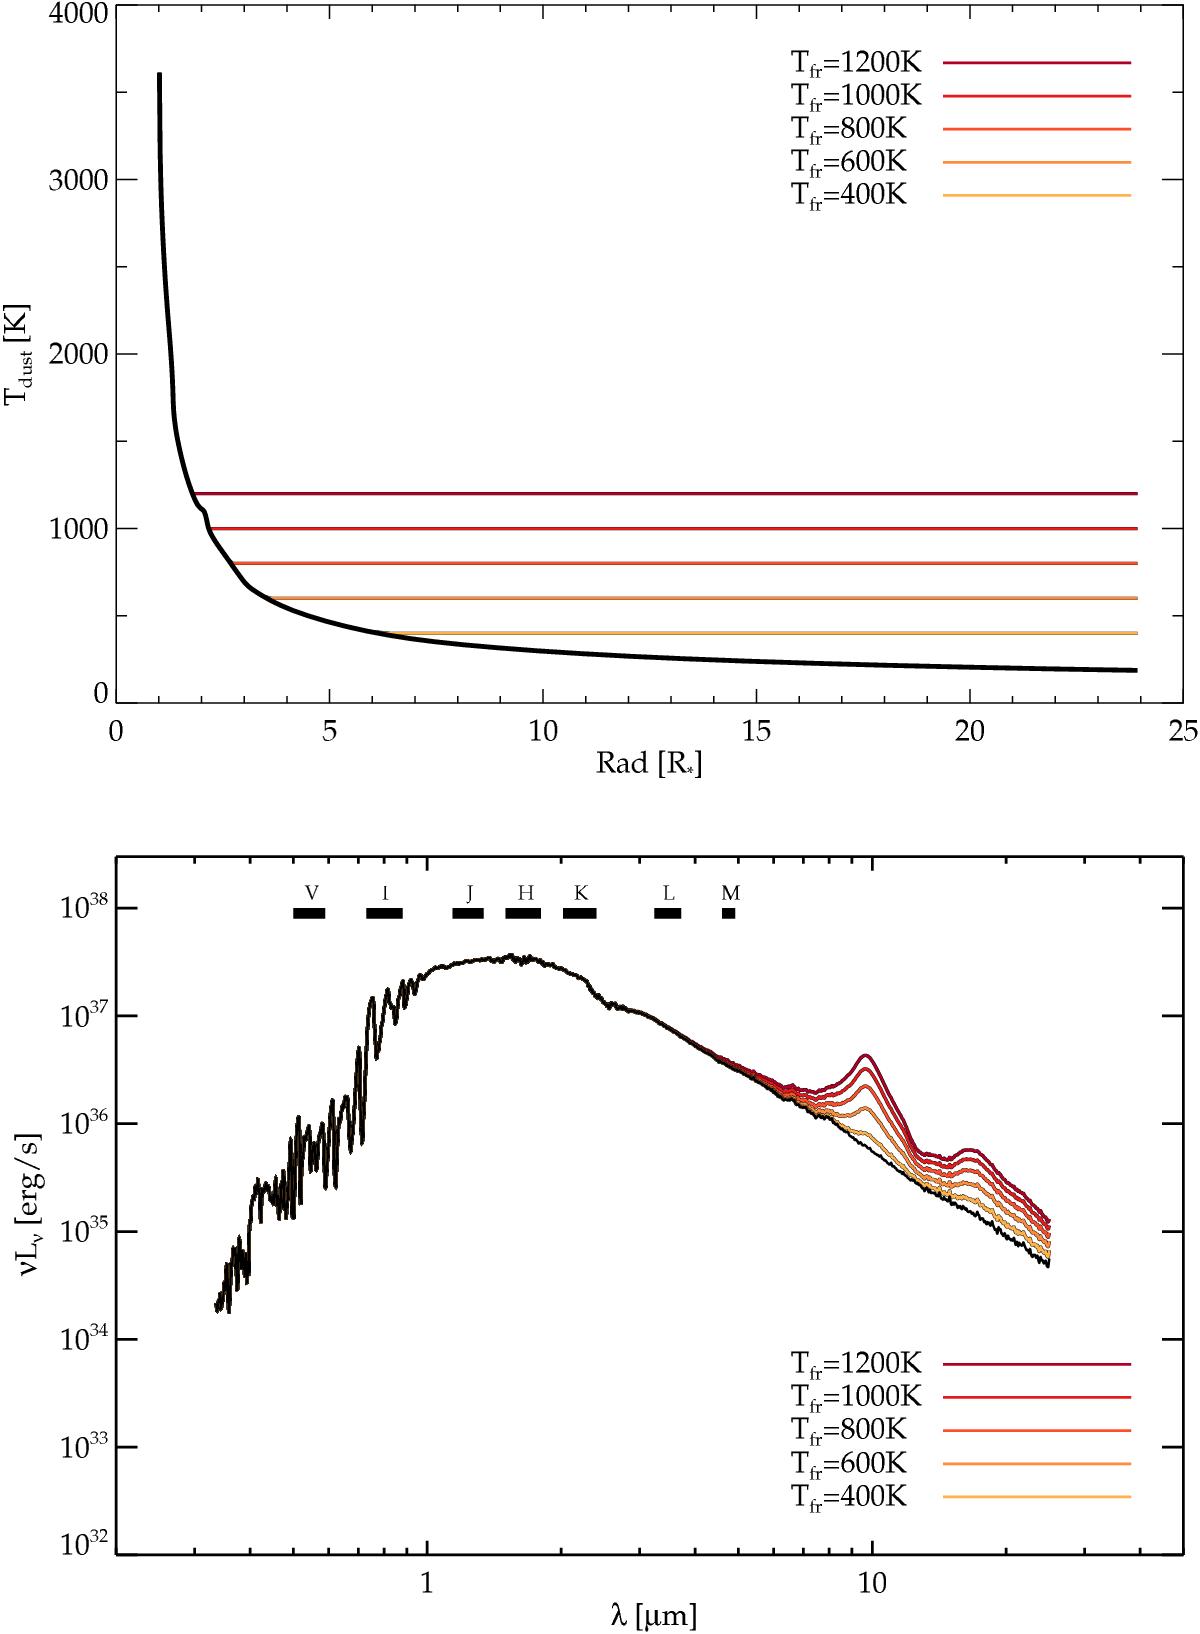
Top panel: grain temperature as a function of distance from the star. Lower panel: spectral energy distributions as a function of wavelength. Structure from model A3 during the maximum phase, with the minimum grain temperature Tfr set to 400 K, 600 K, 800 K, 1000 K and 1200 K (the black curve shows the original model structure).
Current usage metrics show cumulative count of Article Views (full-text article views including HTML views, PDF and ePub downloads, according to the available data) and Abstracts Views on Vision4Press platform.
Data correspond to usage on the plateform after 2015. The current usage metrics is available 48-96 hours after online publication and is updated daily on week days.
Initial download of the metrics may take a while.