Fig. 4
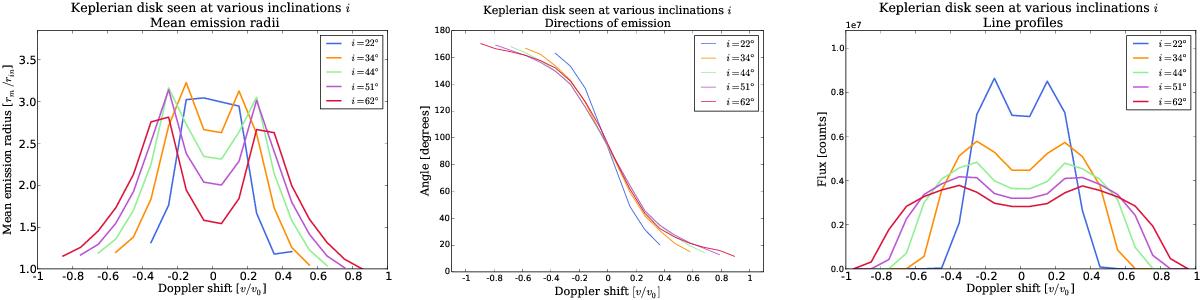
Keplerian disk model. Left: the mean emission radius as a function of the Doppler velocity shift. Middle: the mean emission direction relative to x′-axis as a function of the Doppler velocity shift. Right: the broad emission line profiles. As explained in Sect. 2.1.4, the small red/blue asymmetries seen in the mean emission radii and the line profiles are not physical.

Current usage metrics show cumulative count of Article Views (full-text article views including HTML views, PDF and ePub downloads, according to the available data) and Abstracts Views on Vision4Press platform.
Data correspond to usage on the plateform after 2015. The current usage metrics is available 48-96 hours after online publication and is updated daily on week days.
Initial download of the metrics may take a while.