Fig. 6
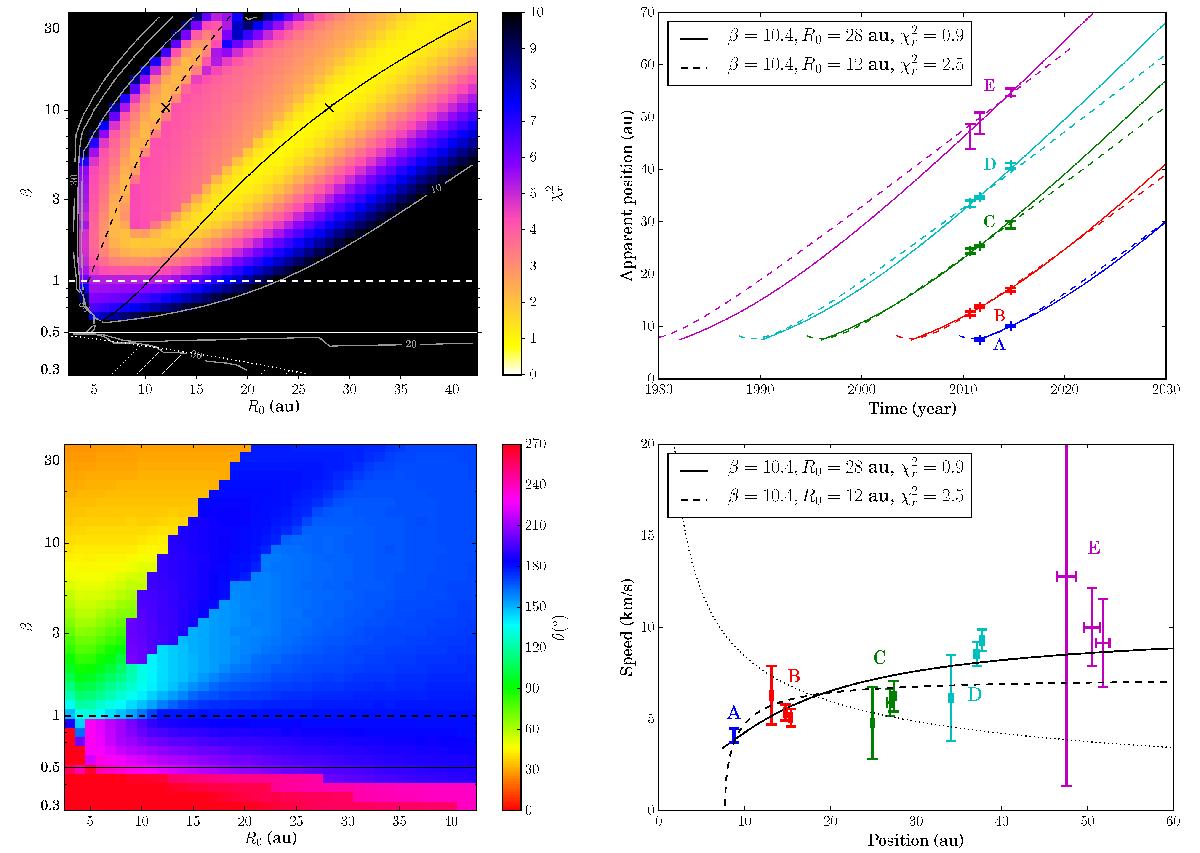
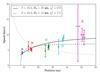
Static parent body. Modeling results in the case of a static parent body. Top left: map of the reduced χ2 (![]() ) obtained by fitting the position of the five structures. The solid and dashed black lines show the expected power law trends (Eq. (9)) along the two families of solutions, each scaled to go through the best fits identified by the black crosses. The branch of highest R0 values corresponds to trajectories going away from the observer, while the other branch identifies the solutions pointing to the observer (see also Fig. A.1). The area under the dotted white line are solutions excluded by Eq. (7). Bottom left: map of the angle of emission, taken with respect to the observer. Top right: projected positions as a function of time. The solid lines correspond to trajectories going away from the observer, while the dashed lines are trajectories pointing toward the observer (see also deprojected trajectories seen from above in Fig. A.1). Bottom right: same as Fig. 2, overlaid with the best fit solutions (black crosses in top left panel).
) obtained by fitting the position of the five structures. The solid and dashed black lines show the expected power law trends (Eq. (9)) along the two families of solutions, each scaled to go through the best fits identified by the black crosses. The branch of highest R0 values corresponds to trajectories going away from the observer, while the other branch identifies the solutions pointing to the observer (see also Fig. A.1). The area under the dotted white line are solutions excluded by Eq. (7). Bottom left: map of the angle of emission, taken with respect to the observer. Top right: projected positions as a function of time. The solid lines correspond to trajectories going away from the observer, while the dashed lines are trajectories pointing toward the observer (see also deprojected trajectories seen from above in Fig. A.1). Bottom right: same as Fig. 2, overlaid with the best fit solutions (black crosses in top left panel).
Current usage metrics show cumulative count of Article Views (full-text article views including HTML views, PDF and ePub downloads, according to the available data) and Abstracts Views on Vision4Press platform.
Data correspond to usage on the plateform after 2015. The current usage metrics is available 48-96 hours after online publication and is updated daily on week days.
Initial download of the metrics may take a while.