Fig. 14
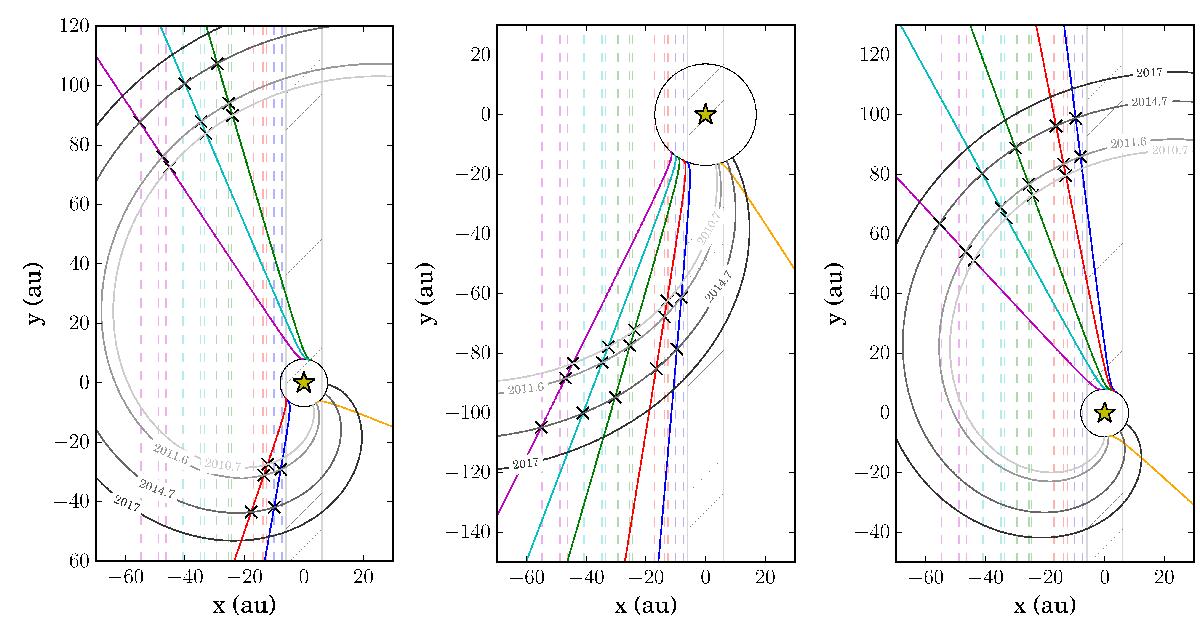
Orbiting parent body. Trajectories of the particles seen from above averaged over the five reference structures (see Sects. 3.2.1 and 3.2.2, for details). Left: model without constraints. Middle: particles going toward the observer. Right: particles going away from the observer. The color-coding is the same as in the previous figures. The orange trajectory for the hypothetical particles released in 2012. The solid black circle is the trajectory of the parent body. The crosses correspond to the observing dates. The gray lines are the positions of the dust in 2010.7, 2011.6, 2014.7, and 2017 (from fainter to darker) if it was continuously emitted by the parent body on its orbit. The hatched area roughly corresponds to the masked inner region in the case of the STIS imager.
Current usage metrics show cumulative count of Article Views (full-text article views including HTML views, PDF and ePub downloads, according to the available data) and Abstracts Views on Vision4Press platform.
Data correspond to usage on the plateform after 2015. The current usage metrics is available 48-96 hours after online publication and is updated daily on week days.
Initial download of the metrics may take a while.